Bank of America 2010 Annual Report Download - page 180
Download and view the complete annual report
Please find page 180 of the 2010 Bank of America annual report below. You can navigate through the pages in the report by either clicking on the pages listed below, or by using the keyword search tool below to find specific information within the annual report.-
 1
1 -
2
-
3
-
4
-
5
-
6
-
7
-
8
-
9
-
10
-
11
-
12
-
13
-
14
-
15
-
16
-
17
-
18
-
19
-
20
-
21
-
22
-
23
-
24
-
25
-
26
-
27
-
28
-
29
-
30
-
31
-
32
-
33
-
34
-
35
-
36
-
37
-
38
-
39
-
40
-
41
-
42
-
43
-
44
-
45
-
46
-
47
-
48
-
49
-
50
-
51
-
52
-
53
-
54
-
55
-
56
-
57
-
58
-
59
-
60
-
61
-
62
-
63
-
64
-
65
-
66
-
67
-
68
-
69
-
70
-
71
-
72
-
73
-
74
-
75
-
76
-
77
-
78
-
79
-
80
-
81
-
82
-
83
-
84
-
85
-
86
-
87
-
88
-
89
-
90
-
91
-
92
-
93
-
94
-
95
-
96
-
97
-
98
-
99
-
100
-
101
-
102
-
103
-
104
-
105
-
106
-
107
-
108
-
109
-
110
-
111
-
112
-
113
-
114
-
115
-
116
-
117
-
118
-
119
-
120
-
121
-
122
-
123
-
124
-
125
-
126
-
127
-
128
-
129
-
130
-
131
-
132
-
133
-
134
-
135
-
136
-
137
-
138
-
139
-
140
-
141
-
142
-
143
-
144
-
145
-
146
-
147
-
148
-
149
-
150
-
151
-
152
-
153
-
154
-
155
-
156
-
157
-
158
-
159
-
160
-
161
-
162
-
163
-
164
-
165
-
166
-
167
-
168
-
169
-
 170
170 -
 171
171 -
 172
172 -
 173
173 -
 174
174 -
 175
175 -
 176
176 -
 177
177 -
 178
178 -
 179
179 -
 180
180 -
 181
181 -
 182
182 -
 183
183 -
 184
184 -
 185
185 -
 186
186 -
 187
187 -
 188
188 -
 189
189 -
 190
190 -
191
-
192
-
193
-
194
-
195
-
196
-
197
-
198
-
199
-
200
-
201
-
202
-
203
-
204
-
205
-
206
-
207
-
208
-
209
-
210
-
211
-
212
-
213
-
214
-
215
-
216
-
217
-
218
-
219
-
220
-
221
-
222
-
223
-
224
-
225
-
226
-
227
-
228
-
229
-
230
-
231
-
232
-
233
-
234
-
235
-
236
-
237
-
238
-
239
-
240
-
241
-
242
-
243
-
244
-
245
-
246
-
247
-
248
-
249
-
250
-
251
-
252
 |
 |

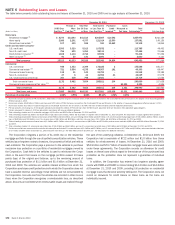
The following tables present the assets and liabilities of consolidated and
unconsolidated VIEs at December 31, 2010 and 2009, in situations where
the Corporation has continuing involvement with transferred assets or if the
Corporation otherwise has a variable interest in the VIE. The tables also
present the Corporation’s maximum exposure to loss at December 31, 2010
and 2009 resulting from its involvement with consolidated VIEs and uncon-
solidated VIEs in which the Corporation holds a variable interest. The Corpo-
ration’s maximum exposure to loss is based on the unlikely event that all of
the assets in the VIEs become worthless and incorporates not only potential
losses associated with assets recorded on the Corporation’s Consolidated
Balance Sheet but also potential losses associated with off-balance sheet
commitments such as unfunded liquidity commitments and other contractual
arrangements. The Corporation’s maximum exposure to loss does not include
losses previously recognized through write-downs of assets on the Corpora-
tion’s Consolidated Balance Sheet.
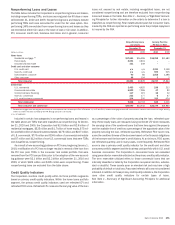
The Corporation invests in asset-backed securities issued by third-party
VIEs with which it has no other form of involvement. These securities are
included in Note 3 – Trading Account Assets and Liabilities and Note 5 –
Securities. In addition, the Corporation uses VIEs such as trust preferred
securities trusts in connection with its funding activities as described in
Note 13 – Long-term Debt. The Corporation also uses VIEs in the form of
synthetic securitization vehicles to mitigate a portion of the credit risk on its
residential mortgage loan portfolio, as described in Note 6 – Outstanding
Loans and Leases. The Corporation uses VIEs, such as cash funds managed
within GWIM, to provide investment opportunities for clients. Prior to 2010,
the Corporation provided support to certain of these cash funds in the form of
capital commitments in the event the net asset value per unit of a fund
declined below certain thresholds. The Corporation recorded a loss of
$195 million in 2009 as the result of these commitments, which were
terminated in 2009. These VIEs, which are not consolidated by the Corpo-
ration, are not included in the tables within this Note.
Except as described below and with regard to the cash funds, as of
December 31, 2010, the Corporation has not provided financial support to
consolidated or unconsolidated VIEs that it was not previously contractually
required to provide, nor does it intend to do so.
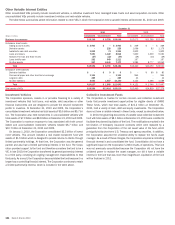
Mortgage-related Securitizations
First-lien Mortgages
As part of its mortgage banking activities, the Corporation securitizes a
portion of the first-lien residential mortgage loans it originates or purchases
from third parties, generally in the form of MBS guaranteed by GSEs, or GNMA
in the case of FHA-insured and U.S. Department of Veteran Affairs (VA)-
guaranteed mortgage loans. Securitization occurs in conjunction with or
shortly after loan closing or purchase. In addition, the Corporation may, from
time to time, securitize commercial mortgages it originates or purchases from
other entities. The Corporation typically services the loans it securitizes.
Further, the Corporation may retain beneficial interests in the securitization
trusts including senior and subordinate securities and equity tranches issued
by the trusts. Except as described below and in Note 9 – Representations and
Warranties Obligations and Corporate Guarantees, the Corporation does not
provide guarantees or recourse to the securitization trusts other than stan-
dard representations and warranties.
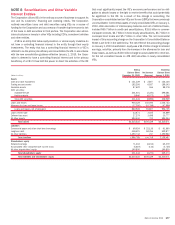
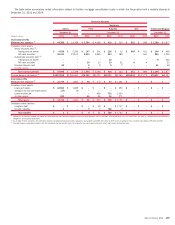
The table below summarizes select information related to first-lien mort-
gage securitizations for 2010 and 2009.
(Dollars in millions)
2010 2009 2010 2009 2010 2009 2010 2009 2010 2009
Agency Prime Subprime Alt-A Mortgage
Non-Agency Commercial
Residential Mortgage
Cash proceeds from new securitizations
(1)
$243,901
$346,448
$–
$–
$–
$–
$7
$–
$4,227
$313
Gain (loss) on securitizations, net of hedges
(2)
(473)
73
–
–
–
–
–
–
–
–
Cash flows received on residual interests
–
–
18
25
58
71
2
5
20
23
(1)
The Corporation sells residential mortgage loans to GSEs in the normal course of business and receives MBS in exchange which may then be sold into the market to third-party investors for cash proceeds.
(2)
Substantially all of the first-lien residential mortgage loans securitized are initially classified as LHFS and accounted for under the fair value option. As such, gains are recognized on these LHFS prior to securitization. During 2010 and
2009, the Corporation recognized $5.1 billion and $5.5 billion of gains on these LHFS, net of hedges.
In addition to cash proceeds as reported in the table above, the Corpo-
ration received securities with an initial fair value of $23.7 billion in connec-
tion with agency first-lien residential mortgage securitizations in 2010. All of
these securities were initially classified as Level 2 assets within the fair value
hierarchy. During 2010, there were no changes to the initial classification.
The Corporation recognizes consumer MSRs from the sale or securitiza-
tion of first-lien mortgage loans. Servicing fee and ancillary fee income on
consumer mortgage loans serviced, including securitizations where the Cor-
poration has continuing involvement, were $6.4 billion and $6.2 billion in
2010 and 2009. Servicing advances on consumer mortgage loans, including
securitizations where the Corporation has continuing involvement, were
$24.3 billion and $19.3 billion at December 31, 2010 and 2009. The
Corporation may have the option to repurchase delinquent loans out of
securitization trusts, which reduces the amount of servicing advances it is
required to make. During 2010 and 2009, $14.5 billion and $13.1 billion of
loans were repurchased from first-lien securitization trusts as a result of loan
delinquencies or in order to perform modifications. The majority of these
loans repurchased were FHA insured mortgages collateralizing GNMA secu-
rities. In addition, the Corporation has retained commercial MSRs from the
sale or securitization of commercial mortgage loans. Servicing fee and an-
cillary fee income on commercial mortgage loans serviced, including securi-
tizations where the Corporation has continuing involvement, were $21 million
and $49 million in 2010 and 2009. Servicing advances on commercial
mortgage loans, including securitizations where the Corporation has continu-
ing involvement, were $156 million and $109 million at December 31, 2010
and 2009.
178 Bank of America 2010