Bank of America 2010 Annual Report Download - page 239
Download and view the complete annual report
Please find page 239 of the 2010 Bank of America annual report below. You can navigate through the pages in the report by either clicking on the pages listed below, or by using the keyword search tool below to find specific information within the annual report.-
 1
1 -
2
-
3
-
4
-
5
-
6
-
7
-
8
-
9
-
10
-
11
-
12
-
13
-
14
-
15
-
16
-
17
-
18
-
19
-
20
-
21
-
22
-
23
-
24
-
25
-
26
-
27
-
28
-
29
-
30
-
31
-
32
-
33
-
34
-
35
-
36
-
37
-
38
-
39
-
40
-
41
-
42
-
43
-
44
-
45
-
46
-
47
-
48
-
49
-
50
-
51
-
52
-
53
-
54
-
55
-
56
-
57
-
58
-
59
-
60
-
61
-
62
-
63
-
64
-
65
-
66
-
67
-
68
-
69
-
70
-
71
-
72
-
73
-
74
-
75
-
76
-
77
-
78
-
79
-
80
-
81
-
82
-
83
-
84
-
85
-
86
-
87
-
88
-
89
-
90
-
91
-
92
-
93
-
94
-
95
-
96
-
97
-
98
-
99
-
100
-
101
-
102
-
103
-
104
-
105
-
106
-
107
-
108
-
109
-
110
-
111
-
112
-
113
-
114
-
115
-
116
-
117
-
118
-
119
-
120
-
121
-
122
-
123
-
124
-
125
-
126
-
127
-
128
-
129
-
130
-
131
-
132
-
133
-
134
-
135
-
136
-
137
-
138
-
139
-
140
-
141
-
142
-
143
-
144
-
145
-
146
-
147
-
148
-
149
-
150
-
151
-
152
-
153
-
154
-
155
-
156
-
157
-
158
-
159
-
160
-
161
-
162
-
163
-
164
-
165
-
166
-
167
-
168
-
169
-
170
-
171
-
172
-
173
-
174
-
175
-
176
-
177
-
178
-
179
-
180
-
181
-
182
-
183
-
184
-
185
-
186
-
187
-
188
-
189
-
190
-
191
-
192
-
193
-
194
-
195
-
196
-
197
-
198
-
199
-
200
-
201
-
202
-
203
-
204
-
205
-
206
-
207
-
208
-
209
-
210
-
211
-
212
-
213
-
214
-
215
-
216
-
217
-
218
-
219
-
220
-
221
-
222
-
223
-
224
-
225
-
226
-
227
-
228
-
 229
229 -
 230
230 -
 231
231 -
 232
232 -
 233
233 -
 234
234 -
 235
235 -
 236
236 -
 237
237 -
 238
238 -
 239
239 -
 240
240 -
 241
241 -
 242
242 -
 243
243 -
 244
244 -
 245
245 -
 246
246 -
 247
247 -
 248
248 -
 249
249 -
250
-
251
-
252
 |
 |

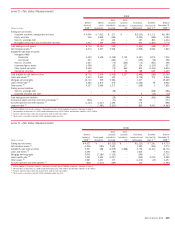
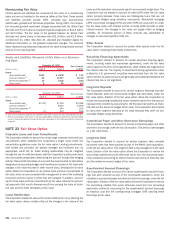
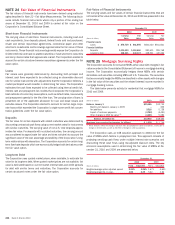
The table below presents the sensitivity of the weighted-average lives and
fair value of MSRs to changes in modeled assumptions. These sensitivities
are hypothetical and should be used with caution. As the amounts indicate,
changes in fair value based on variations in assumptions generally cannot be
extrapolated because the relationship of the change in assumption to the
change in fair value may not be linear. Also, the effect of a variation in a
particular assumption on the fair value of MSRs that continue to be held by
the Corporation is calculated without changing any other assumption. In
reality, changes in one factor may result in changes in another, which might
magnify or counteract the sensitivities. The below sensitivities do not reflect
any hedge strategies that may be undertaken to mitigate such risk.
Commercial and residential reverse mortgage MSRs, which are carried at
the lower of cost or market value and accounted for using the amortization
method, totaled $278 million and $309 million at December 31, 2010 and
2009, and are not included in the table below.
(Dollars in millions)
Fixed Adjustable
Change in
Fair Value
Change in
Weighted-average Lives
December 31, 2010
Prepayment rates
Impact of 10% decrease 0.33 years 0.16 years $ 907
Impact of 20% decrease 0.70 0.34 1,925
Impact of 10% increase (0.29) (0.14) (814)
Impact of 20% increase (0.55) (0.26) (1,551)
OAS level
Impact of 100 bps decrease n/a n/a $ 796
Impact of 200 bps decrease n/a n/a 1,668
Impact of 100 bps increase n/a n/a (729)
Impact of 200 bps increase n/a n/a (1,398)
n/a = not applicable
NOTE 26 Business Segment Information
The Corporation reports the results of its operations through six business
segments: Deposits, Global Card Services, Home Loans & Insurance, Global
Commercial Banking, Global Banking & Markets (GBAM) and Global Wealth &
Investment Management (GWIM), with the remaining operations recorded in
All Other. Effective January 1, 2010, the Corporation realigned the Global
Corporate and Investment Banking portion of the former Global Banking
business segment with the former Global Markets business segment to
form GBAM and to reflect Global Commercial Banking as a standalone
segment. In addition, the Corporation may periodically reclassify business
segment results based on modifications to its management reporting meth-
odologies and changes in organizational alignment. Prior period amounts have
been reclassified to conform to current period presentation.
Deposits
Deposits includes the results of consumer deposits activities which consist of
a comprehensive range of products provided to consumers and small busi-
nesses. In addition, Deposits includes an allocation of ALM activities. Deposit
products include traditional savings accounts, money market savings ac-
counts, CDs and IRAs, and noninterest- and interest-bearing checking ac-
counts. These products provide a relatively stable source of funding and
liquidity. The Corporation earns net interest spread revenue from investing
this liquidity in earning assets through client-facing lending and ALM activities.
The revenue is allocated to the deposit products using a funds transfer pricing
process which takes into account the interest rates and maturity character-
istics of the deposits. Deposits also generates fees such as account service
fees, non-sufficient funds fees, overdraft charges and ATM fees. In addition,
Deposits includes the net impact of migrating customers and their related
deposit balances between GWIM and Deposits. Subsequent to the date of
migration, the associated net interest income, service charges and non-
interest expense are recorded in the business to which deposits were
transferred.
Global Card Services
Global Card Services provides a broad offering of products including U.S. con-
sumer and business card, consumer lending, international card and debit
card to consumers and small businesses. The Corporation reports its Global
Card Services current period results in accordance with new consolidation
guidance that was effective on January 1, 2010. Under this new consolidation
guidance, the Corporation consolidated all previously unconsolidated credit
card trusts. Accordingly, current year results are comparable to prior year
results that were presented on a managed basis, which was consistent with
the way that management evaluated the results of the business. Managed
basis assumed that securitized loans were not sold and presented earnings
on these loans in a manner similar to the way loans that have not been sold
(i.e., held loans) are presented. Loan securitization is an alternative funding
process that is used by the Corporation to diversify funding sources. Global
Card Services managed income statement line items differ from a held basis
as follows: managed net interest income includes Global Card Services net
interest income on held loans and interest income on the securitized loans
less the internal funds transfer pricing allocation related to securitized loans;
managed noninterest income includes Global Card Services noninterest
income on a held basis less the reclassification of certain components of
card income (e.g., excess servicing income) to record securitized net interest
income and provision for credit losses; and provision for credit losses rep-
resents the provision for credit losses on held loans combined with realized
credit losses associated with the securitized loan portfolio.
Home Loans & Insurance
Home Loans & Insurance provides an extensive line of consumer real estate
products and services to customers nationwide. Home Loans & Insurance
products include fixed and adjustable-rate first-lien mortgage loans for home
purchase and refinancing needs, reverse mortgages, home equity lines of
credit and home equity loans. First mortgage products are either sold into the
secondary mortgage market to investors while retaining MSRs and the Bank
of America customer relationships, or are held on the Corporation’s Consol-
idated Balance Sheet for ALM purposes and reported in All Other. Home
Loans & Insurance is not impacted by the Corporation’s first mortgage
production retention decisions as Home Loans & Insurance is compensated
for the decision on a management accounting basis with a corresponding
offset recorded in All Other. Funded home equity lines of credit and home
equity loans are held on the Corporation’s Consolidated Balance Sheet. In
addition, Home Loans & Insurance offers property, casualty, life, disability and
credit insurance. Home Loans & Insurance also includes the impact of
migrating customers and their related loan balances between GWIM and
Home Loans & Insurance based on client segmentation thresholds. Subse-
quent to the date of migration, the associated net interest income and
noninterest expense are recorded in the business segment to which loans
were transferred.
Bank of America 2010 237