Bank of America 2010 Annual Report Download - page 90
Download and view the complete annual report
Please find page 90 of the 2010 Bank of America annual report below. You can navigate through the pages in the report by either clicking on the pages listed below, or by using the keyword search tool below to find specific information within the annual report.-
 1
1 -
2
-
3
-
4
-
5
-
6
-
7
-
8
-
9
-
10
-
11
-
12
-
13
-
14
-
15
-
16
-
17
-
18
-
19
-
20
-
21
-
22
-
23
-
24
-
25
-
26
-
27
-
28
-
29
-
30
-
31
-
32
-
33
-
34
-
35
-
36
-
37
-
38
-
39
-
40
-
41
-
42
-
43
-
44
-
45
-
46
-
47
-
48
-
49
-
50
-
51
-
52
-
53
-
54
-
55
-
56
-
57
-
58
-
59
-
60
-
61
-
62
-
63
-
64
-
65
-
66
-
67
-
68
-
69
-
70
-
71
-
72
-
73
-
74
-
75
-
76
-
77
-
78
-
79
-
 80
80 -
 81
81 -
 82
82 -
 83
83 -
 84
84 -
 85
85 -
 86
86 -
 87
87 -
 88
88 -
 89
89 -
 90
90 -
 91
91 -
 92
92 -
 93
93 -
 94
94 -
 95
95 -
 96
96 -
 97
97 -
 98
98 -
 99
99 -
 100
100 -
101
-
102
-
103
-
104
-
105
-
106
-
107
-
108
-
109
-
110
-
111
-
112
-
113
-
114
-
115
-
116
-
117
-
118
-
119
-
120
-
121
-
122
-
123
-
124
-
125
-
126
-
127
-
128
-
129
-
130
-
131
-
132
-
133
-
134
-
135
-
136
-
137
-
138
-
139
-
140
-
141
-
142
-
143
-
144
-
145
-
146
-
147
-
148
-
149
-
150
-
151
-
152
-
153
-
154
-
155
-
156
-
157
-
158
-
159
-
160
-
161
-
162
-
163
-
164
-
165
-
166
-
167
-
168
-
169
-
170
-
171
-
172
-
173
-
174
-
175
-
176
-
177
-
178
-
179
-
180
-
181
-
182
-
183
-
184
-
185
-
186
-
187
-
188
-
189
-
190
-
191
-
192
-
193
-
194
-
195
-
196
-
197
-
198
-
199
-
200
-
201
-
202
-
203
-
204
-
205
-
206
-
207
-
208
-
209
-
210
-
211
-
212
-
213
-
214
-
215
-
216
-
217
-
218
-
219
-
220
-
221
-
222
-
223
-
224
-
225
-
226
-
227
-
228
-
229
-
230
-
231
-
232
-
233
-
234
-
235
-
236
-
237
-
238
-
239
-
240
-
241
-
242
-
243
-
244
-
245
-
246
-
247
-
248
-
249
-
250
-
251
-
252
 |
 |

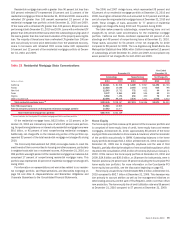
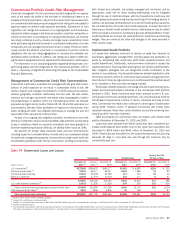
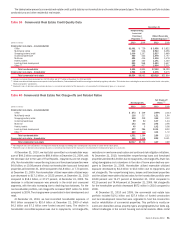
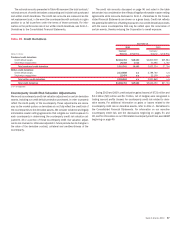
Nonperforming commercial loans and leases as a percentage of out-
standing commercial loans and leases were 3.32 percent (3.35 percent
excluding loans accounted for under the fair value option) and 3.98 percent
(4.00 percent excluding loans accounted for under the fair value option) at
December 31, 2010 and 2009. Accruing commercial loans and leases past
due 90 days or more as a percentage of outstanding commercial loans and
leases were 0.21 percent (0.22 percent excluding loans accounted for under
the fair value option) and 0.34 percent (0.32 percent excluding loans ac-
counted for under the fair value option) at December 31, 2010 and 2009.
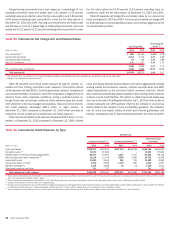
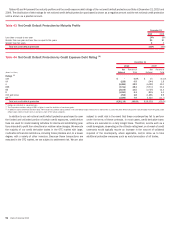
Table 35 presents net charge-offs and related ratios for our commercial
loans and leases for 2010 and 2009. Commercial real estate net charge-offs
for 2010 declined in the homebuilder portfolio and in certain segments of the
non-homebuilder portfolio.
Table 35 Commercial Net Charge-offs and Related Ratios
(Dollars in millions)
2010 2009 2010 2009
Net Charge-offs
Net Charge-off
Ratios
(1)
U.S. commercial
(2)
$881
$2,190
0.50%
1.09%
Commercial real estate
2,017
2,702
3.37
3.69
Commercial lease financing
57
195
0.27
0.89
Non-U.S. commercial
111
537
0.39
1.76
3,066
5,624
1.07
1.72
U.S. small business commercial
1,918
2,886
12.00
15.68
Total commercial
$4,984
$8,510
1.64
2.47
(1)
Net charge-off ratios are calculated as net charge-offs divided by average outstanding loans and leases excluding loans accounted for under the fair value option.
(2)
Excludes U.S. small business commercial loans.
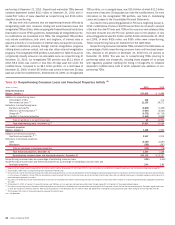
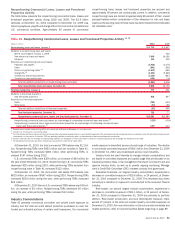
Table 36 presents commercial credit exposure by type for utilized, un-
funded and total binding committed credit exposure. Commercial utilized
credit exposure includes SBLCs, financial guarantees, bankers’ acceptances
and commercial letters of credit for which the Corporation is legally bound to
advance funds under prescribed conditions, during a specified period. Al-
though funds have not yet been advanced, these exposure types are consid-
ered utilized for credit risk management purposes. Total commercial commit-
ted credit exposure decreased $68.1 billion, or eight percent, at
December 31, 2010 compared to December 31, 2009 driven primarily by
reductions in both funded and unfunded loan and lease exposure.
Total commercial utilized credit exposure decreased $45.1 billion, or nine
percent, at December 31, 2010 compared to December 31, 2009. Utilized
loans and leases declined as businesses continued to aggressively manage
working capital and production capacity, maintain low inventories and defer
capital expenditures as the economic outlook remained uncertain. Clients
also continued to access the capital markets for their funding needs to reduce
reliance on bank credit facilities. The decline in utilized loans and leases was
also due to the sale of First Republic effective July 1, 2010 and the transfer of
certain exposures into LHFS partially offset by the increase in conduit bal-
ances related to the adoption of new consolidation guidance. The utilization
rate for loans and leases, letters of credit and financial guarantees, and
bankers’ acceptances was 57 percent at both December 31, 2010 and 2009.
Table 36 Commercial Credit Exposure by Type
(Dollars in millions)
2010 2009 2010 2009 2010 2009
Commercial Utilized
(1)
Commercial Unfunded
(2, 3)
Total Commercial
Committed
December 31
Loans and leases
$296,990
$322,564
$272,172
$298,048
$569,162
$620,612
Derivative assets
(4)
73,000
87,622
–
–
73,000
87,622
Standby letters of credit and financial guarantees
62,027
67,975
1,511
1,767
63,538
69,742
Debt securities and other investments
(5)
10,216
11,754
4,546
1,508
14,762
13,262
Loans held-for-sale
10,380
8,169
242
781
10,622
8,950
Commercial letters of credit
3,372
2,958
1,179
569
4,551
3,527
Bankers’ acceptances
3,706
3,658
23
16
3,729
3,674
Foreclosed properties and other
731
797
–
–
731
797
Total commercial credit exposure
$460,422
$505,497
$279,673
$302,689
$740,095
$808,186
(1)
Total commercial utilized exposure at December 31, 2010 and 2009 includes loans and issued letters of credit accounted for under the fair value option including loans outstanding of $3.3 billion and $4.9 billion and letters of credit
with a notional value of $1.4 billion and $1.7 billion.
(2)
Total commercial unfunded exposure at December 31, 2010 and 2009 includes loan commitments accounted for under the fair value option with a notional value of $25.9 billion and $25.3 billion.
(3)
Excludes unused business card lines which are not legally binding.
(4)
Derivativeassets are carried at fair value, reflect the effects of legally enforceable master netting agreements and have been reduced by cash collateral of $58.3 billion and $51.5 billion atDecember 31, 2010 and 2009. Not reflected
in utilized and committed exposure is additional derivative collateral held of $17.7 billion and $16.2 billion which consists primarily of other marketable securities.
(5)
Total commercial committed exposure consists of $14.2 billion and $9.8 billion of debt securities and $590 million and $3.5 billion of other investments at December 31, 2010 and 2009.
88 Bank of America 2010