Bank of America 2010 Annual Report Download - page 224
Download and view the complete annual report
Please find page 224 of the 2010 Bank of America annual report below. You can navigate through the pages in the report by either clicking on the pages listed below, or by using the keyword search tool below to find specific information within the annual report.-
 1
1 -
2
-
3
-
4
-
5
-
6
-
7
-
8
-
9
-
10
-
11
-
12
-
13
-
14
-
15
-
16
-
17
-
18
-
19
-
20
-
21
-
22
-
23
-
24
-
25
-
26
-
27
-
28
-
29
-
30
-
31
-
32
-
33
-
34
-
35
-
36
-
37
-
38
-
39
-
40
-
41
-
42
-
43
-
44
-
45
-
46
-
47
-
48
-
49
-
50
-
51
-
52
-
53
-
54
-
55
-
56
-
57
-
58
-
59
-
60
-
61
-
62
-
63
-
64
-
65
-
66
-
67
-
68
-
69
-
70
-
71
-
72
-
73
-
74
-
75
-
76
-
77
-
78
-
79
-
80
-
81
-
82
-
83
-
84
-
85
-
86
-
87
-
88
-
89
-
90
-
91
-
92
-
93
-
94
-
95
-
96
-
97
-
98
-
99
-
100
-
101
-
102
-
103
-
104
-
105
-
106
-
107
-
108
-
109
-
110
-
111
-
112
-
113
-
114
-
115
-
116
-
117
-
118
-
119
-
120
-
121
-
122
-
123
-
124
-
125
-
126
-
127
-
128
-
129
-
130
-
131
-
132
-
133
-
134
-
135
-
136
-
137
-
138
-
139
-
140
-
141
-
142
-
143
-
144
-
145
-
146
-
147
-
148
-
149
-
150
-
151
-
152
-
153
-
154
-
155
-
156
-
157
-
158
-
159
-
160
-
161
-
162
-
163
-
164
-
165
-
166
-
167
-
168
-
169
-
170
-
171
-
172
-
173
-
174
-
175
-
176
-
177
-
178
-
179
-
180
-
181
-
182
-
183
-
184
-
185
-
186
-
187
-
188
-
189
-
190
-
191
-
192
-
193
-
194
-
195
-
196
-
197
-
198
-
199
-
200
-
201
-
202
-
203
-
204
-
205
-
206
-
207
-
208
-
209
-
210
-
211
-
212
-
213
-
 214
214 -
 215
215 -
 216
216 -
 217
217 -
 218
218 -
 219
219 -
 220
220 -
 221
221 -
 222
222 -
 223
223 -
 224
224 -
 225
225 -
 226
226 -
 227
227 -
 228
228 -
 229
229 -
 230
230 -
 231
231 -
 232
232 -
 233
233 -
 234
234 -
235
-
236
-
237
-
238
-
239
-
240
-
241
-
242
-
243
-
244
-
245
-
246
-
247
-
248
-
249
-
250
-
251
-
252
 |
 |

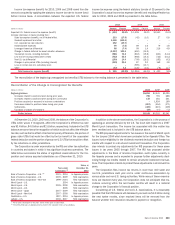
Stock Options Details
The following table presents the status of all option plans at December 31,
2010 and changes during 2010. Outstanding options at December 31, 2010
include 36 million options under the Key Employee Stock Plan, 140 million
options under the Key Associate Stock Plan and 85 million options to em-
ployees of predecessor companies assumed in mergers.
Options
Weighted-
average
Exercise
Price
Outstanding at January 1, 2010 303,722,748 $49.71
Exercised (4,959) 14.82
Forfeited (42,594,970) 44.16
Outstanding at December 31, 2010 261,122,819 50.61
Options exercisable at December 31, 2010
255,615,840 50.77
Options vested and expected to vest
(1)
261,113,002 50.61
(1)
Includes vested shares and nonvested shares after a forfeiture rate is applied.
At December 31, 2010, there was no aggregate intrinsic value of options
outstanding, exercisable, and vested and expected to vest. The weighted-
average remaining contractual term of options outstanding was 3.0 years,
options exercisable was 3.0 years, and options vested and expected to vest
was 3.1 years at December 31, 2010. These remaining contractual terms are
similar because options have not been granted since 2008 and they generally
vest in three years.
The weighted-average grant-date fair value of options granted in 2008 was
$8.92. No options were granted in 2010 or 2009.
The table below presents the assumptions used to estimate the fair value
of stock options granted on the date of grant using the lattice option-pricing
model for 2008. No stock options were granted in 2010 or 2009. Lattice
option-pricing models incorporate ranges of assumptions for inputs and those
ranges are disclosed in the table below. The risk-free interest rate for periods
within the contractual life of the stock option is based on the U.S. Treasury
yield curve in effect at the time of grant. Expected volatilities are based on
implied volatilities from traded stock options on the Corporation’s common
stock, historical volatility of the Corporation’s common stock, and other
factors. The Corporation uses historical data to estimate stock option exer-
cise and employee termination within the model. The expected term of stock
options granted is derived from the output of the model and represents the
period of time that stock options granted are expected to be outstanding. The
estimates of fair value from these models are theoretical values for stock
options and changes in the assumptions used in the models could result in
materially different fair value estimates. The actual value of the stock options
will depend on the market value of the Corporation’s common stock when the
stock options are exercised.
2008
Risk-free interest rate 2.05 – 3.85%
Dividend yield 5.3
Expected volatility 26.00 – 36.00
Weighted-average volatility 32.8
Expected lives (years) 6.6
Excluded from the previous table are assumptions used to estimate the
fair value of 108 million stock options assumed in connection with the Merrill
Lynch acquisition with an aggregate fair value of $1.1 billion. The fair value of
these awards was estimated using a Black-Scholes option pricing model.
Similar to options valued using the lattice option-pricing model described
above, key assumptions used include the implied volatility based on the
Corporation’s common stock of 75 percent, the risk-free interest rate based
on the U.S. Treasury yield curve in effect at December 31, 2008, an expected
dividend yield of 4.2 percent and the expected life of the options based on
their actual remaining term.
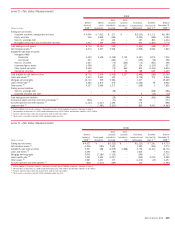
NOTE 21 Income Taxes
The components of income tax expense (benefit) for 2010, 2009 and 2008
were as presented in the table below.
(Dollars in millions)
2010 2009 2008
Current income tax expense (benefit)
U.S. federal
$(666)
$(3,576) $ 5,075
U.S. state and local
158
555 561
Non-U.S.
815
735 585
Total current expense (benefit)
307
(2,286) 6,221
Deferred income tax expense (benefit)
U.S. federal
(287)
792 (5,269)
U.S. state and local
201
(620) (520)
Non-U.S.
694
198 (12)
Total deferred expense (benefit)
608
370 (5,801)
Total income tax expense (benefit)
$915
$(1,916) $ 420
Total income tax expense (benefit) does not reflect the deferred tax effects
of unrealized gains and losses on AFS debt and marketable equity securities,
foreign currency translation adjustments, derivatives and employee benefit
plan adjustments that are included in accumulated OCI. As a result of these
tax effects, accumulated OCI decreased $3.2 billion and $1.6 billion in 2010
and 2009, and increased $5.9 billion in 2008. In addition, total income tax
expense (benefit) does not reflect tax effects associated with the Corpora-
tion’s employee stock plans which decreased common stock and additional
paid-in capital $98 million, $295 million and $9 million in 2010, 2009 and
2008, respectively.
222 Bank of America 2010