Bank of America 2010 Annual Report Download - page 98
Download and view the complete annual report
Please find page 98 of the 2010 Bank of America annual report below. You can navigate through the pages in the report by either clicking on the pages listed below, or by using the keyword search tool below to find specific information within the annual report.-
 1
1 -
2
-
3
-
4
-
5
-
6
-
7
-
8
-
9
-
10
-
11
-
12
-
13
-
14
-
15
-
16
-
17
-
18
-
19
-
20
-
21
-
22
-
23
-
24
-
25
-
26
-
27
-
28
-
29
-
30
-
31
-
32
-
33
-
34
-
35
-
36
-
37
-
38
-
39
-
40
-
41
-
42
-
43
-
44
-
45
-
46
-
47
-
48
-
49
-
50
-
51
-
52
-
53
-
54
-
55
-
56
-
57
-
58
-
59
-
60
-
61
-
62
-
63
-
64
-
65
-
66
-
67
-
68
-
69
-
70
-
71
-
72
-
73
-
74
-
75
-
76
-
77
-
78
-
79
-
80
-
81
-
82
-
83
-
84
-
85
-
86
-
87
-
 88
88 -
 89
89 -
 90
90 -
 91
91 -
 92
92 -
 93
93 -
 94
94 -
 95
95 -
 96
96 -
 97
97 -
 98
98 -
 99
99 -
 100
100 -
 101
101 -
 102
102 -
 103
103 -
 104
104 -
 105
105 -
 106
106 -
 107
107 -
 108
108 -
109
-
110
-
111
-
112
-
113
-
114
-
115
-
116
-
117
-
118
-
119
-
120
-
121
-
122
-
123
-
124
-
125
-
126
-
127
-
128
-
129
-
130
-
131
-
132
-
133
-
134
-
135
-
136
-
137
-
138
-
139
-
140
-
141
-
142
-
143
-
144
-
145
-
146
-
147
-
148
-
149
-
150
-
151
-
152
-
153
-
154
-
155
-
156
-
157
-
158
-
159
-
160
-
161
-
162
-
163
-
164
-
165
-
166
-
167
-
168
-
169
-
170
-
171
-
172
-
173
-
174
-
175
-
176
-
177
-
178
-
179
-
180
-
181
-
182
-
183
-
184
-
185
-
186
-
187
-
188
-
189
-
190
-
191
-
192
-
193
-
194
-
195
-
196
-
197
-
198
-
199
-
200
-
201
-
202
-
203
-
204
-
205
-
206
-
207
-
208
-
209
-
210
-
211
-
212
-
213
-
214
-
215
-
216
-
217
-
218
-
219
-
220
-
221
-
222
-
223
-
224
-
225
-
226
-
227
-
228
-
229
-
230
-
231
-
232
-
233
-
234
-
235
-
236
-
237
-
238
-
239
-
240
-
241
-
242
-
243
-
244
-
245
-
246
-
247
-
248
-
249
-
250
-
251
-
252
 |
 |

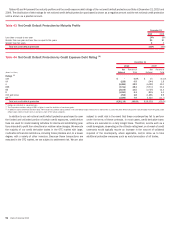
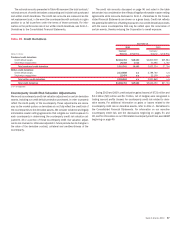
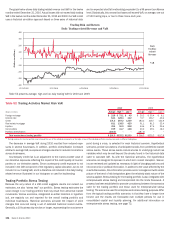
Tables 43 and 44 present the maturity profiles and the credit exposure debt ratings of the net credit default protection portfolio at December 31, 2010 and
2009. The distribution of debt ratings for net notional credit default protection purchased is shown as a negative amount and the net notional credit protection
sold is shown as a positive amount.
Table 43 Net Credit Default Protection by Maturity Profile
2010 2009
December 31
Less than or equal to one year
14%
16%
Greater than one year and less than or equal to five years
80
81
Greater than five years
6
3
Total net credit default protection
100%
100%
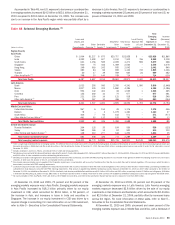
Table 44 Net Credit Default Protection by Credit Exposure Debt Rating
(1)
(Dollars in millions)
Net
Notional
Percent of
Total
Net
Notional
Percent of
Total
2010 2009
December 31
Ratings
(2)
AAA
$ – 0.0%
$ 15 (0.1)%
AA
(188) 0.9
(344) 1.8
A
(6,485) 32.2
(6,092) 32.0
BBB
(7,731) 38.4
(9,573) 50.4
BB
(2,106) 10.5
(2,725) 14.3
B
(1,260) 6.3
(835) 4.4
CCC and below
(762) 3.8
(1,691) 8.9
NR
(3)
(1,586) 7.9
2,220 (11.7)
Total net credit default protection
$(20,118) 100.0%
$(19,025) 100.0%
(1)
Ratings are refreshed on a quarterly basis.
(2)
The Corporation considers ratings of BBB- or higher to meet the definition of investment grade.
(3)
In addition to names which have not been rated, “NR” includes $(1.5) billion and $2.3 billion in net credit default swaps index positions at December 31, 2010 and 2009. While index positions are principally investment grade, credit
default swaps indices include names in and across each of the ratings categories.
In addition to our net notional credit default protection purchased to cover
the funded and unfunded portion of certain credit exposures, credit deriva-
tives are used for market-making activities for clients and establishing posi-
tions intended to profit from directional or relative value changes. We execute
the majority of our credit derivative trades in the OTC market with large,
multinational financial institutions, including broker/dealers and, to a lesser
degree, with a variety of other investors. Because these transactions are
executed in the OTC market, we are subject to settlement risk. We are also
subject to credit risk in the event that these counterparties fail to perform
under the terms of these contracts. In most cases, credit derivative trans-
actions are executed on a daily margin basis. Therefore, events such as a
credit downgrade, depending on the ultimate rating level, or a breach of credit
covenants would typically require an increase in the amount of collateral
required of the counterparty, where applicable, and/or allow us to take
additional protective measures such as early termination of all trades.
96 Bank of America 2010