Bank of America 2010 Annual Report Download - page 30
Download and view the complete annual report
Please find page 30 of the 2010 Bank of America annual report below. You can navigate through the pages in the report by either clicking on the pages listed below, or by using the keyword search tool below to find specific information within the annual report.-
 1
1 -
2
-
3
-
4
-
5
-
6
-
7
-
8
-
9
-
10
-
11
-
12
-
13
-
14
-
15
-
16
-
17
-
18
-
19
-
 20
20 -
 21
21 -
 22
22 -
 23
23 -
 24
24 -
 25
25 -
 26
26 -
 27
27 -
 28
28 -
 29
29 -
 30
30 -
 31
31 -
 32
32 -
 33
33 -
 34
34 -
 35
35 -
 36
36 -
 37
37 -
 38
38 -
 39
39 -
 40
40 -
41
-
42
-
43
-
44
-
45
-
46
-
47
-
48
-
49
-
50
-
51
-
52
-
53
-
54
-
55
-
56
-
57
-
58
-
59
-
60
-
61
-
62
-
63
-
64
-
65
-
66
-
67
-
68
-
69
-
70
-
71
-
72
-
73
-
74
-
75
-
76
-
77
-
78
-
79
-
80
-
81
-
82
-
83
-
84
-
85
-
86
-
87
-
88
-
89
-
90
-
91
-
92
-
93
-
94
-
95
-
96
-
97
-
98
-
99
-
100
-
101
-
102
-
103
-
104
-
105
-
106
-
107
-
108
-
109
-
110
-
111
-
112
-
113
-
114
-
115
-
116
-
117
-
118
-
119
-
120
-
121
-
122
-
123
-
124
-
125
-
126
-
127
-
128
-
129
-
130
-
131
-
132
-
133
-
134
-
135
-
136
-
137
-
138
-
139
-
140
-
141
-
142
-
143
-
144
-
145
-
146
-
147
-
148
-
149
-
150
-
151
-
152
-
153
-
154
-
155
-
156
-
157
-
158
-
159
-
160
-
161
-
162
-
163
-
164
-
165
-
166
-
167
-
168
-
169
-
170
-
171
-
172
-
173
-
174
-
175
-
176
-
177
-
178
-
179
-
180
-
181
-
182
-
183
-
184
-
185
-
186
-
187
-
188
-
189
-
190
-
191
-
192
-
193
-
194
-
195
-
196
-
197
-
198
-
199
-
200
-
201
-
202
-
203
-
204
-
205
-
206
-
207
-
208
-
209
-
210
-
211
-
212
-
213
-
214
-
215
-
216
-
217
-
218
-
219
-
220
-
221
-
222
-
223
-
224
-
225
-
226
-
227
-
228
-
229
-
230
-
231
-
232
-
233
-
234
-
235
-
236
-
237
-
238
-
239
-
240
-
241
-
242
-
243
-
244
-
245
-
246
-
247
-
248
-
249
-
250
-
251
-
252
 |
 |

Executive Summary
Business Overview
The Corporation is a Delaware corporation, a bank holding company and a
financial holding company. When used in this report, “the Corporation” may
refer to the Corporation individually, the Corporation and its subsidiaries, or
certain of the Corporation’s subsidiaries or affiliates. Our principal executive
offices are located in the Bank of America Corporate Center in Charlotte,
North Carolina. Through our banking and various nonbanking subsidiaries
throughout the United States and in certain international markets, we provide
a diversified range of banking and nonbanking financial services and products
through six business segments: Deposits, Global Card Services, Home
Loans & Insurance, Global Commercial Banking, Global Banking & Markets
(GBAM) and Global Wealth & Investment Management (GWIM), with the
remaining operations recorded in All Other. Effective Januar y 1, 2010, we
realigned the Global Corporate and Investment Banking portion of the former
Global Banking business segment with the former Global Markets business
segment to form GBAM and to reflect Global Commercial Banking as a
standalone segment. At December 31, 2010, the Corporation had $2.3
trillion in assets and approximately 288,000 full-time equivalent employees.
On January 1, 2009, we acquired Merrill Lynch & Co., Inc. (Merrill Lynch) and,
as a result, we now have one of the largest wealth management businesses in
the world with nearly 17,000 wealth advisors, an additional 3,000 client-
facing professionals and more than $2.2 trillion in client assets. Additionally,
we are a global leader in corporate and investment banking and trading across
a broad range of asset classes serving corporations, governments, institu-
tions and individuals around the world.
As of December 31, 2010, we operate in all 50 states, the District of
Columbia and more than 40 non-U.S. countries. Our retail banking footprint
covers approximately 80 percent of the U.S. population and in the U.S., we
serve approximately 57 million consumer and small business relationships
with 5,900 banking centers, 18,000 ATMs, nationwide call centers, and
leading online and mobile banking platforms. We have banking centers in
13 of the 15 fastest growing states and have leadership positions in market
share for deposits in seven of those states. We offer industry-leading support
to approximately four million small business owners.
For information on recent and proposed legislative and regulatory initia-
tives that may affect our business, see Regulatory Matters beginning on
page 60.
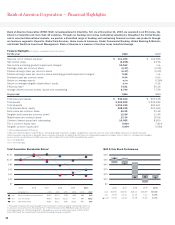
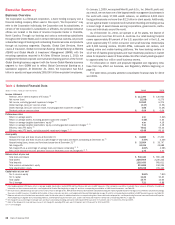
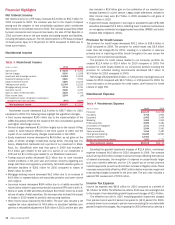
The table below provides selected consolidated financial data for 2010
and 2009.
Table 1 Selected Financial Data
(Dollars in millions, except per share information)
2010 2009
Income statement
Revenue, net of interest expense (FTE basis)
(1)
$ 111,390
$120,944
Net income (loss)
(2,238)
6,276
Net income, excluding goodwill impairment charges
(2)
10,162
6,276
Diluted earnings (loss) per common share
(0.37)
(0.29)
Diluted earnings (loss) per common share, excluding goodwill impairment charges
(2)
0.86
(0.29)
Dividends paid per common share
$0.04
$0.04
Performance ratios
Return on average assets
n/m
0.26%
Return on average assets, excluding goodwill impairment charges
(2)
0.42%
0.26
Return on average tangible shareholders’ equity
(1)
n/m
4.18
Return on average tangible shareholders’ equity, excluding goodwill impairment charges
(1, 2)
7.11
4.18
Efficiency ratio (FTE basis)
(1)
74.61
55.16
Efficiency ratio (FTE basis), excluding goodwill impairment charges
(1, 2)
63.48
55.16
Asset quality
Allowance for loan and lease losses at December 31
$41,885
$37,200
Allowance for loan and lease losses as a percentage of total loans and leases outstanding at December 31
(3)
4.47%
4.16%
Nonperforming loans, leases and foreclosed properties at December 31
(3)
$32,664
$35,747
Net charge-offs
34,334
33,688
Net charge-offs as a percentage of average loans and leases outstanding
(3, 4)
3.60%
3.58%
Ratio of the allowance for loan and lease losses at December 31 to net charge-offs
(3, 5)
1.22
1.10
Balance sheet at year end
Total loans and leases
$ 940,440
$900,128
Total assets
2,264,909
2,230,232
Total deposits
1,010,430
991,611
Total common shareholders’ equity
211,686
194,236
Total shareholders’ equity
228,248
231,444
Capital ratios at year end
Tier 1 common equity
8.60%
7.81%
Tier 1 capital
11.24
10.40
Total capital
15.77
14.66
Tier 1 leverage
7.21
6.88
(1)
Fully taxable-equivalent (FTE) basis, return on average tangible shareholders’ equity (ROTE) and the efficiency ratio are non-GAAP measures. Other companies may define or calculate these measures differently. For additional
information on these measures and ratios, see Supplemental Financial Data beginning on page 40, and for a corresponding reconciliation to GAAP financial measures, see Table XIII.
(2)
Net income (loss), diluted earnings (loss) per common share, return on average assets, ROTE and the efficiency ratio have been calculated excluding the impact of goodwill impairment charges of $12.4 billion in 2010 and accordingly,
these are non-GAAP measures. For additional information on these measures and ratios, see Supplemental Financial Data beginning on page 40, and for a corresponding reconciliation to GAAP financial measures, see Table XIII.
(3)
Balances and ratios do not include loans accounted for under the fair value option. For additional exclusions on nonperforming loans, leases and foreclosed properties, see Nonperforming Consumer Loans and Foreclosed Properties
Activity beginning on page 85 and corresponding Table 33, and Nonperforming Commercial Loans, Leases and Foreclosed Properties Activity and corresponding Table 41 on page 93.
(4)
Net charge-offs as a percentage of average loans and leases outstanding excluding purchased credit-impaired (PCI) loans were 3.73 percent and 3.71 percent for 2010 and 2009.
(5)
Ratio of the allowance for loan and lease losses to net charge-offs excluding (PCI) loans was 1.04 percent and 1.00 percent for 2010 and 2009.
n/m = not meaningful
28 Bank of America 2010