Bank of America 2010 Annual Report Download - page 241
Download and view the complete annual report
Please find page 241 of the 2010 Bank of America annual report below. You can navigate through the pages in the report by either clicking on the pages listed below, or by using the keyword search tool below to find specific information within the annual report.-
 1
1 -
2
-
3
-
4
-
5
-
6
-
7
-
8
-
9
-
10
-
11
-
12
-
13
-
14
-
15
-
16
-
17
-
18
-
19
-
20
-
21
-
22
-
23
-
24
-
25
-
26
-
27
-
28
-
29
-
30
-
31
-
32
-
33
-
34
-
35
-
36
-
37
-
38
-
39
-
40
-
41
-
42
-
43
-
44
-
45
-
46
-
47
-
48
-
49
-
50
-
51
-
52
-
53
-
54
-
55
-
56
-
57
-
58
-
59
-
60
-
61
-
62
-
63
-
64
-
65
-
66
-
67
-
68
-
69
-
70
-
71
-
72
-
73
-
74
-
75
-
76
-
77
-
78
-
79
-
80
-
81
-
82
-
83
-
84
-
85
-
86
-
87
-
88
-
89
-
90
-
91
-
92
-
93
-
94
-
95
-
96
-
97
-
98
-
99
-
100
-
101
-
102
-
103
-
104
-
105
-
106
-
107
-
108
-
109
-
110
-
111
-
112
-
113
-
114
-
115
-
116
-
117
-
118
-
119
-
120
-
121
-
122
-
123
-
124
-
125
-
126
-
127
-
128
-
129
-
130
-
131
-
132
-
133
-
134
-
135
-
136
-
137
-
138
-
139
-
140
-
141
-
142
-
143
-
144
-
145
-
146
-
147
-
148
-
149
-
150
-
151
-
152
-
153
-
154
-
155
-
156
-
157
-
158
-
159
-
160
-
161
-
162
-
163
-
164
-
165
-
166
-
167
-
168
-
169
-
170
-
171
-
172
-
173
-
174
-
175
-
176
-
177
-
178
-
179
-
180
-
181
-
182
-
183
-
184
-
185
-
186
-
187
-
188
-
189
-
190
-
191
-
192
-
193
-
194
-
195
-
196
-
197
-
198
-
199
-
200
-
201
-
202
-
203
-
204
-
205
-
206
-
207
-
208
-
209
-
210
-
211
-
212
-
213
-
214
-
215
-
216
-
217
-
218
-
219
-
220
-
221
-
222
-
223
-
224
-
225
-
226
-
227
-
228
-
229
-
230
-
 231
231 -
 232
232 -
 233
233 -
 234
234 -
 235
235 -
 236
236 -
 237
237 -
 238
238 -
 239
239 -
 240
240 -
 241
241 -
 242
242 -
 243
243 -
 244
244 -
 245
245 -
 246
246 -
 247
247 -
 248
248 -
 249
249 -
 250
250 -
 251
251 -
252
 |
 |

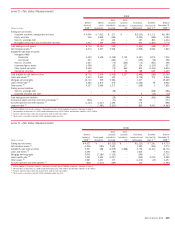
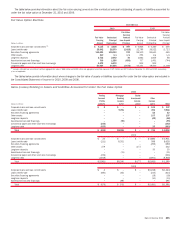
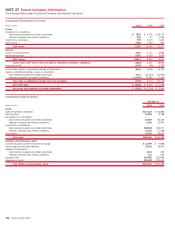
The following tables present total revenue, net of interest expense, on a FTE basis and net income (loss) for 2010, 2009 and 2008, and total assets at
December 31, 2010 and 2009 for each business segment, as well as All Other.
Business Segments
At and for the Year Ended December 31
(Dollars in millions)
2010 2009 2008 2010 2009 2008 2010 2009 2008
Total Corporation
(1)
Deposits Global Card Services
(2)
Net interest income
(3)
$52,693
$ 48,410 $46,554
$8,128
$ 7,089 $10,910
$17,821
$ 19,972 $19,305
Noninterest income
58,697
72,534 27,422
5,053
6,801 6,854
7,800
9,074 11,628
Total revenue, net of interest expense
111,390
120,944 73,976
13,181
13,890 17,764
25,621
29,046 30,933
Provision for credit losses
28,435
48,570 26,825
201
343 390
12,648
29,553 19,575
Amortization of intangibles
1,731
1,977 1,834
195
238 297
813
911 1,048
Goodwill impairment
12,400
––
–
––
10,400
––
Other noninterest expense
68,977
64,736 39,695
10,636
9,263 8,296
6,140
6,815 7,905
Income (loss) before income taxes
(153)
5,661 5,622
2,149
4,046 8,781
(4,380)
(8,233) 2,405
Income tax expense (benefit)
(3)
2,085
(615) 1,614
797
1,470 3,192
2,223
(2,972) 850
Net income (loss)
$ (2,238)
$ 6,276 $ 4,008
$1,352
$ 2,576 $ 5,589
$(6,603)
$ (5,261) $ 1,555
Year end total assets
$2,264,909
$2,230,232
$432,334
$444,612
$169,762
$212,668
2010 2009 2008 2010 2009 2008 2010 2009 2008
Home Loans & Insurance Global Commercial Banking Global Banking & Markets
Net interest income
(3)
$4,690
$ 4,975 $ 3,311
$8,086
$8,054 $8,142
$7,989
$ 9,553 $ 8,297
Noninterest income
5,957
11,928 6,001
2,817
3,087 2,535
20,509
23,070 (5,506)
Total revenue, net of interest expense
10,647
16,903 9,312
10,903
11,141 10,677
28,498
32,623 2,791
Provision for credit losses
8,490
11,244 6,287
1,971
7,768 3,316
(155)
1,998 424
Amortization of intangibles
38
63 39
72
87 127
144
165 91
Goodwill impairment
2,000
––
–
––
–
––
Other noninterest expense
13,125
11,642 6,977
3,802
3,746 3,205
17,894
15,756 7,221
Income (loss) before income taxes
(13,006)
(6,046) (3,991)
5,058
(460) 4,029
10,615
14,704 (4,945)
Income tax expense (benefit)
(3)
(4,085)
(2,195) (1,477)
1,877
(170) 1,418
4,296
4,646 (1,756)
Net income (loss)
$ (8,921)
$ (3,851) $(2,514)
$3,181
$ (290) $ 2,611
$6,319
$ 10,058 $(3,189)
Year end total assets
$213,455
$232,588
$310,131
$295,947
$655,535
$649,876
2010 2009 2008 2010 2009 2008
Global Wealth &
Investment Management All Other
(2)
Net interest income
(3)
$5,831
$ 5,988 $4,780
$148
$ (7,221) $(8,191)
Noninterest income
10,840
10,149 1,527
5,721
8,425 4,383
Total revenue, net of interest expense
16,671
16,137 6,307
5,869
1,204 (3,808)
Provision for credit losses
646
1,061 664
4,634
(3,397) (3,831)
Amortization of intangibles
458
480 192
11
33 40
Other noninterest expense
13,140
11,917 3,872
4,240
5,597 2,219
Income (loss) before income taxes
2,427
2,679 1,579
(3,016)
(1,029) (2,236)
Income tax expense (benefit)
(3)
1,080
963 565
(4,103)
(2,357) (1,178)
Net income (loss)
$1,347
$ 1,716 $1,014
$1,087
$ 1,328 $(1,058)
Year end total assets
$297,301
$250,963
$186,391
$143,578
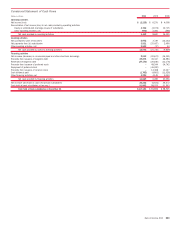
(1)
There were no material intersegment revenues.
(2)
2010 is presented in accordance with new consolidation guidance. 2009 and 2008 Global Card Services results are presented on a managed basis with a corresponding offset recorded in All Other.
(3)
FTE basis
Bank of America 2010 239