Bank of America 2010 Annual Report Download - page 50
Download and view the complete annual report
Please find page 50 of the 2010 Bank of America annual report below. You can navigate through the pages in the report by either clicking on the pages listed below, or by using the keyword search tool below to find specific information within the annual report.-
 1
1 -
2
-
3
-
4
-
5
-
6
-
7
-
8
-
9
-
10
-
11
-
12
-
13
-
14
-
15
-
16
-
17
-
18
-
19
-
20
-
21
-
22
-
23
-
24
-
25
-
26
-
27
-
28
-
29
-
30
-
31
-
32
-
33
-
34
-
35
-
36
-
37
-
38
-
39
-
 40
40 -
 41
41 -
 42
42 -
 43
43 -
 44
44 -
 45
45 -
 46
46 -
 47
47 -
 48
48 -
 49
49 -
 50
50 -
 51
51 -
 52
52 -
 53
53 -
 54
54 -
 55
55 -
 56
56 -
 57
57 -
 58
58 -
 59
59 -
 60
60 -
61
-
62
-
63
-
64
-
65
-
66
-
67
-
68
-
69
-
70
-
71
-
72
-
73
-
74
-
75
-
76
-
77
-
78
-
79
-
80
-
81
-
82
-
83
-
84
-
85
-
86
-
87
-
88
-
89
-
90
-
91
-
92
-
93
-
94
-
95
-
96
-
97
-
98
-
99
-
100
-
101
-
102
-
103
-
104
-
105
-
106
-
107
-
108
-
109
-
110
-
111
-
112
-
113
-
114
-
115
-
116
-
117
-
118
-
119
-
120
-
121
-
122
-
123
-
124
-
125
-
126
-
127
-
128
-
129
-
130
-
131
-
132
-
133
-
134
-
135
-
136
-
137
-
138
-
139
-
140
-
141
-
142
-
143
-
144
-
145
-
146
-
147
-
148
-
149
-
150
-
151
-
152
-
153
-
154
-
155
-
156
-
157
-
158
-
159
-
160
-
161
-
162
-
163
-
164
-
165
-
166
-
167
-
168
-
169
-
170
-
171
-
172
-
173
-
174
-
175
-
176
-
177
-
178
-
179
-
180
-
181
-
182
-
183
-
184
-
185
-
186
-
187
-
188
-
189
-
190
-
191
-
192
-
193
-
194
-
195
-
196
-
197
-
198
-
199
-
200
-
201
-
202
-
203
-
204
-
205
-
206
-
207
-
208
-
209
-
210
-
211
-
212
-
213
-
214
-
215
-
216
-
217
-
218
-
219
-
220
-
221
-
222
-
223
-
224
-
225
-
226
-
227
-
228
-
229
-
230
-
231
-
232
-
233
-
234
-
235
-
236
-
237
-
238
-
239
-
240
-
241
-
242
-
243
-
244
-
245
-
246
-
247
-
248
-
249
-
250
-
251
-
252
 |
 |

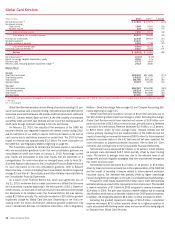
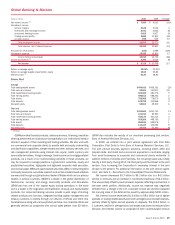
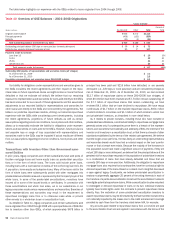
Global Commercial Banking
(Dollars in millions)
2010 2009 % Change
Net interest income
(1)
$8,086
$8,054 –%
Noninterest income:
Service charges
2,105
2,078 1
All other income
712
1,009 (29)
Total noninterest income
2,817
3,087 (9)
Total revenue, net of interest expense
10,903
11,141 (2)
Provision for credit losses
1,971
7,768 (75)
Noninterest expense
3,874
3,833 1
Income (loss) before income taxes
5,058
(460) n/m
Income tax expense (benefit)
(1)
1,877
(170) n/m
Net income (loss)
$3,181
$ (290) n/m
Net interest yield
(1)
2.94%
3.19%
Return on average tangible shareholders’ equity
15.20
n/m
Return on average equity
7.64
n/m
Efficiency ratio
(1)
35.52
34.40
Balance Sheet
Average
Total loans and leases
$203,339
$229,102 (11)%
Total earning assets
275,356
252,309 9
Total assets
306,302
283,936 8
Total dep osits
148,565
129,832 14
Allocated equity
41,624
41,931 (1)
Year end
Total loans and leases
$193,573
$215,237 (10)%
Total earning assets
277,551
264,855 5
Total assets
310,131
295,947 5
Total dep osits
161,260
147,023 10
Allocated equity
40,607
42,975 (6)
(1)
FTE basis
n/m = not meaningful
Global Commercial Banking provides a wide range of lending-related
products and services, integrated working capital management and treasury
solutions to clients through our network of offices and client relationship
teams along with various product partners. Our clients include business
banking and middle-market companies, commercial real estate firms and
governments, and are generally defined as companies with annual sales up to
$2 billion. Our lending products and services include commercial loans and
commitment facilities, real estate lending, asset-based lending and indirect
consumer loans. Our capital management and treasury solutions include
treasury management, foreign exchange and short-term investing options.
Global Commercial Banking recorded 2010 net income of $3.2 billion
compared to a 2009 net loss of $290 million, with the improvement driven by
lower credit costs.
Net interest income remained relatively flat as growth in average deposits
from our existing clients of $18.7 billion, or 14 percent, was offset by a lower
net interest income allocation related to ALM activities. In addition, net
interest income benefited from credit pricing discipline, which negated the
impact of the $25.8 billion, or 11 percent, decline in average loan balances.
Noninterest income decreased $270 million, or nine percent, largely due
to additional costs related to our agreement to purchase certain retail auto-
motive loans. For further information, see Note 14 – Commitments and
Contingencies to the Consolidated Financial Statements.
The provision for credit losses decreased $5.8 billion to $2.0 billion for
2010 compared to 2009. The decrease was driven by improvements primarily
in the commercial real estate portfolios reflecting stabilizing values and in the
U.S. commercial portfolio resulting from improved borrower credit profiles.
Additionally, all other portfolios experienced lower net charge-offs attributable
to more stable economic conditions.
Global Commercial Banking Revenue
Global Commercial Banking revenues can also be categorized as treasury
services revenue primarily from capital and treasury management, and busi-
ness lending revenue derived from credit related products and services.
Treasury services revenue for 2010 was $4.3 billion, an increase of $62 mil-
lion compared to 2009. Revenue growth was driven by net interest income
from increased deposits, partially offset by lower treasury service charges. As
clients manage through current economic conditions, we have seen usage of
certain treasury services decline and increased conversion of paper to
electronic services. These actions combined with our clients leveraging
compensating balances to offset fees have decreased treasury service
charges. Business lending revenue for 2010 was $6.6 billion, a decrease
of $299 million compared to 2009, largely due to additional costs related to
our agreement to purchase certain retail automotive loans. Despite client
deleveraging in the first half of 2010 and continued low loan demand,
commercial and industrial loan balances began to stabilize and show mod-
erate growth during the latter part of 2010. Commercial real estate loan
balances declined due to continued client deleveraging and our management
of nonperforming loans. Credit pricing discipline negated the impact of the
decline in average loan balances on net interest income.
48 Bank of America 2010