Bank of America 2010 Annual Report Download - page 81
Download and view the complete annual report
Please find page 81 of the 2010 Bank of America annual report below. You can navigate through the pages in the report by either clicking on the pages listed below, or by using the keyword search tool below to find specific information within the annual report.-
 1
1 -
2
-
3
-
4
-
5
-
6
-
7
-
8
-
9
-
10
-
11
-
12
-
13
-
14
-
15
-
16
-
17
-
18
-
19
-
20
-
21
-
22
-
23
-
24
-
25
-
26
-
27
-
28
-
29
-
30
-
31
-
32
-
33
-
34
-
35
-
36
-
37
-
38
-
39
-
40
-
41
-
42
-
43
-
44
-
45
-
46
-
47
-
48
-
49
-
50
-
51
-
52
-
53
-
54
-
55
-
56
-
57
-
58
-
59
-
60
-
61
-
62
-
63
-
64
-
65
-
66
-
67
-
68
-
69
-
70
-
 71
71 -
 72
72 -
 73
73 -
 74
74 -
 75
75 -
 76
76 -
 77
77 -
 78
78 -
 79
79 -
 80
80 -
 81
81 -
 82
82 -
 83
83 -
 84
84 -
 85
85 -
 86
86 -
 87
87 -
 88
88 -
 89
89 -
 90
90 -
 91
91 -
92
-
93
-
94
-
95
-
96
-
97
-
98
-
99
-
100
-
101
-
102
-
103
-
104
-
105
-
106
-
107
-
108
-
109
-
110
-
111
-
112
-
113
-
114
-
115
-
116
-
117
-
118
-
119
-
120
-
121
-
122
-
123
-
124
-
125
-
126
-
127
-
128
-
129
-
130
-
131
-
132
-
133
-
134
-
135
-
136
-
137
-
138
-
139
-
140
-
141
-
142
-
143
-
144
-
145
-
146
-
147
-
148
-
149
-
150
-
151
-
152
-
153
-
154
-
155
-
156
-
157
-
158
-
159
-
160
-
161
-
162
-
163
-
164
-
165
-
166
-
167
-
168
-
169
-
170
-
171
-
172
-
173
-
174
-
175
-
176
-
177
-
178
-
179
-
180
-
181
-
182
-
183
-
184
-
185
-
186
-
187
-
188
-
189
-
190
-
191
-
192
-
193
-
194
-
195
-
196
-
197
-
198
-
199
-
200
-
201
-
202
-
203
-
204
-
205
-
206
-
207
-
208
-
209
-
210
-
211
-
212
-
213
-
214
-
215
-
216
-
217
-
218
-
219
-
220
-
221
-
222
-
223
-
224
-
225
-
226
-
227
-
228
-
229
-
230
-
231
-
232
-
233
-
234
-
235
-
236
-
237
-
238
-
239
-
240
-
241
-
242
-
243
-
244
-
245
-
246
-
247
-
248
-
249
-
250
-
251
-
252
 |
 |

Residential mortgage loans with a greater than 90 percent but less than
100 percent refreshed LTV represented 10 percent and 11 percent of the
residential mortgage portfolio at December 31, 2010 and 2009. Loans with a
refreshed LTV greater than 100 percent represented 23 percent of the
residential mortgage loan portfolio at both December 31, 2010 and 2009.
Of the loans with a refreshed LTV greater than 100 percent, 88 percent were
performing at both December 31, 2010 and 2009. Loans with a refreshed LTV
greater than 100 percent reflect loans where the outstanding carrying value of
the loan is greater than the most recent valuation of the property securing the
loan. The majority of these loans have a refreshed LTV greater than 100 per-
cent due primarily to home price deterioration from the weakened economy.
Loans to borrowers with refreshed FICO scores below 620 represented
14 percent and 12 percent of the residential mortgage portfolio at Decem-
ber 31, 2010 and 2009.
The 2006 and 2007 vintage loans, which represented 38 percent and
42 percent of our residential mortgage portfolio at December 31, 2010 and
2009, have higher refreshed LTVs and accounted for 67 percent and 69 per-
cent of nonperforming residential mortgage loans at December 31, 2010 and
2009. These vintages of loans accounted for 77 percent of residential
mortgage net charge-offs during 2010 and 75 percent during 2009.
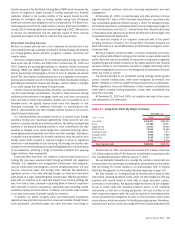
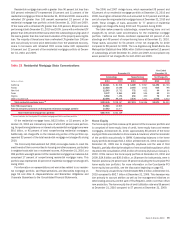
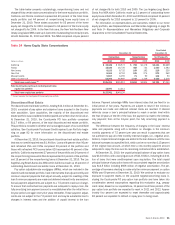
The table below presents outstandings, nonperforming loans and net
charge-offs by certain state concentrations for the residential mortgage
portfolio. California and Florida combined represented 42 percent of out-
standings and 48 percent of nonperforming loans at December 31, 2010.
These states accounted for 54 percent of the net charge-offs for 2010
compared to 58 percent for 2009. The Los Angeles-Long Beach-Santa Ana
Metropolitan Statistical Area (MSA) within California represented 13 percent
of outstandings at both December 31, 2010 and 2009, but comprised only
seven percent of net charge-offs for both 2010 and 2009.
Table 22 Residential Mortgage State Concentrations
(Dollars in millions)
2010 2009 2010 2009 2010 2009
Outstandings Nonperforming Net Charge-offs
December 31
Year Ended
December 31
California
$68,341
$81,508
$6,389
$5,967
$1,392
$1,726
Florida
13,616
15,088
2,054
1,912
604
796
New York
12,545
15,752
772
632
44
66
Texas
9,077
9,865
492
534
52
59
Virginia
6,960
7,496
450
450
72
89
Other U.S./Non-U.S.
82,896
88,438
7,534
7,101
1,506
1,614
Total residential mortgage loans
(1)
$193,435
$218,147
$17,691
$16,596
$3,670
$4,350
Total FHA insured loans
53,946
12,905
Total Countrywide purchased credit-impaired residential mortgage portfolio
10,592
11,077
Total residential mortgage loan portfolio
$257,973
$242,129
(1)
Amount excludes the Countrywide PCI residential mortgage and FHA insured loan portfolios.
Of the residential mortgage loans, $62.5 billion, or 32 percent, at De-
cember 31, 2010 are interest-only loans of which 87 percent were perform-
ing. Nonperforming balances on interest-only residential mortgage loans were
$8.0 billion, or 45 percent of total nonperforming residential mortgages.
Additionally, net charge-offs on the interest-only portion of the portfolio rep-
resented 53 percent of the total residential mortgage net charge-offs during
2010.
The Community Reinvestment Act (CRA) encourages banks to meet the
credit needs of their communities for housing and other purposes, particularly
in neighborhoods with low or moderate incomes. At December 31, 2010, our
CRA portfolio was eight percent of the residential mortgage loan balances but
comprised 17 percent of nonperforming residential mortgage loans. This
portfolio also represented 23 percent of residential mortgage net charge-offs
during 2010.
For information on representations and warranties related to our residen-
tial mortgage portfolio, see Representations and Warranties beginning on
page 56 and Note 9 – Representations and Warranties Obligations and
Corporate Guarantees to the Consolidated Financial Statements.
Home Equity
The home equity portfolio makes up 21 percent of the consumer portfolio and
is comprised of home equity lines of credit, home equity loans and reverse
mortgages. At December 31, 2010, approximately 88 percent of the home
equity portfolio was included in Home Loans & Insurance, while the remainder
of the portfolio was primarily in GWIM. Outstanding balances in the home
equity portfolio decreased $11.1 billion at December 31, 2010 compared to
December 31, 2009 due to charge-offs, paydowns and the sale of First
Republic, partially offset by the adoption of new consolidation guidance, which
resulted in the consolidation of $5.1 billion of home equity loans on January 1,
2010. Of the loans in the home equity portfolio at December 31, 2010 and
2009, $24.8 billion and $26.0 billion, or 18 percent for both periods, were in
first-lien positions (20 percent and 19 percent excluding the Countrywide PCI
home equity loan portfolio). For more information on the Countrywide PCI
home equity loan portfolio, see the discussion beginning on page 82.
Home equity unused lines of credit totaled $80.1 billion at December 31,
2010 compared to $92.7 billion at December 31, 2009. This decrease was
due primarily to account attrition as well as line management initiatives on
deteriorating accounts and the sale of First Republic, which more than offset
new production. The home equity line of credit utilization rate was 59 percent
at December 31, 2010 compared to 57 percent at December 31, 2009.
Bank of America 2010 79