Bank of America 2010 Annual Report Download - page 167
Download and view the complete annual report
Please find page 167 of the 2010 Bank of America annual report below. You can navigate through the pages in the report by either clicking on the pages listed below, or by using the keyword search tool below to find specific information within the annual report.-
 1
1 -
2
-
3
-
4
-
5
-
6
-
7
-
8
-
9
-
10
-
11
-
12
-
13
-
14
-
15
-
16
-
17
-
18
-
19
-
20
-
21
-
22
-
23
-
24
-
25
-
26
-
27
-
28
-
29
-
30
-
31
-
32
-
33
-
34
-
35
-
36
-
37
-
38
-
39
-
40
-
41
-
42
-
43
-
44
-
45
-
46
-
47
-
48
-
49
-
50
-
51
-
52
-
53
-
54
-
55
-
56
-
57
-
58
-
59
-
60
-
61
-
62
-
63
-
64
-
65
-
66
-
67
-
68
-
69
-
70
-
71
-
72
-
73
-
74
-
75
-
76
-
77
-
78
-
79
-
80
-
81
-
82
-
83
-
84
-
85
-
86
-
87
-
88
-
89
-
90
-
91
-
92
-
93
-
94
-
95
-
96
-
97
-
98
-
99
-
100
-
101
-
102
-
103
-
104
-
105
-
106
-
107
-
108
-
109
-
110
-
111
-
112
-
113
-
114
-
115
-
116
-
117
-
118
-
119
-
120
-
121
-
122
-
123
-
124
-
125
-
126
-
127
-
128
-
129
-
130
-
131
-
132
-
133
-
134
-
135
-
136
-
137
-
138
-
139
-
140
-
141
-
142
-
143
-
144
-
145
-
146
-
147
-
148
-
149
-
150
-
151
-
152
-
153
-
154
-
155
-
156
-
 157
157 -
 158
158 -
 159
159 -
 160
160 -
 161
161 -
 162
162 -
 163
163 -
 164
164 -
 165
165 -
 166
166 -
 167
167 -
 168
168 -
 169
169 -
 170
170 -
 171
171 -
 172
172 -
 173
173 -
 174
174 -
 175
175 -
 176
176 -
 177
177 -
178
-
179
-
180
-
181
-
182
-
183
-
184
-
185
-
186
-
187
-
188
-
189
-
190
-
191
-
192
-
193
-
194
-
195
-
196
-
197
-
198
-
199
-
200
-
201
-
202
-
203
-
204
-
205
-
206
-
207
-
208
-
209
-
210
-
211
-
212
-
213
-
214
-
215
-
216
-
217
-
218
-
219
-
220
-
221
-
222
-
223
-
224
-
225
-
226
-
227
-
228
-
229
-
230
-
231
-
232
-
233
-
234
-
235
-
236
-
237
-
238
-
239
-
240
-
241
-
242
-
243
-
244
-
245
-
246
-
247
-
248
-
249
-
250
-
251
-
252
 |
 |

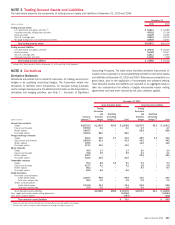
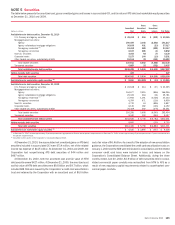
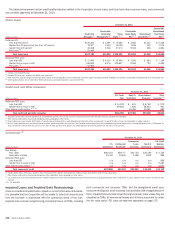
NOTE 5 Securities
The table below presents the amortized cost, gross unrealized gains and losses in accumulated OCI, and fair value of AFS debt and marketable equity securities
at December 31, 2010 and 2009.
(Dollars in millions)
Amortized
Cost
Gross
Unrealized
Gains
Gross
Unrealized
Losses Fair Value
Available-for-sale debt securities, December 31, 2010
U.S. Treasury and agency securities
$ 49,413 $ 604 $ (912) $ 49,105
Mortgage-backed securities:
Agency
190,409 3,048 (2,240) 191,217
Agency collateralized mortgage obligations
36,639 401 (23) 37,017
Non-agency residential
(1)
23,458 588 (929) 23,117
Non-agency commercial
6,167 686 (1) 6,852
Non-U.S. securities
4,054 92 (7) 4,139
Corporate bonds
5,157 144 (10) 5,291
Other taxable securities, substantially all ABS
15,514 39 (161) 15,392
Total taxable securities
330,811 5,602 (4,283) 332,130
Tax-exempt securities
5,687 32 (222) 5,497
Total available-for-sale debt securities $336,498 $ 5,634 $(4,505) $337,627
Held-to-maturity debt securities 427 – – 427
Total debt securities $336,925 $ 5,634 $(4,505) $338,054
Available-for-sale marketable equity securities
(2)
$ 8,650 $10,628 $ (13) $ 19,265
Available-for-sale debt securities, December 31, 2009
U.S. Treasury and agency securities $ 22,648 $ 414 $ (37) $ 23,025
Mortgage-backed securities:
Agency 164,677 2,415 (846) 166,246
Agency collateralized mortgage obligations 25,330 464 (13) 25,781
Non-agency residential
(1)
37,940 1,191 (4,028) 35,103
Non-agency commercial 6,354 671 (116) 6,909
Non-U.S. securities 4,732 61 (896) 3,897
Corporate bonds 6,136 182 (126) 6,192
Other taxable securities, substantially all ABS 25,469 260 (478) 25,251
Total taxable securities 293,286 5,658 (6,540) 292,404
Tax-exempt securities 9,340 100 (243) 9,197
Total available-for-sale debt securities
$302,626 $ 5,758 $(6,783) $301,601
Held-to-maturity debt securities
9,800 – (100) 9,700
Total debt securities
$312,426 $ 5,758 $(6,883) $311,301
Available-for-sale marketable equity securities
(2)
$ 6,020 $ 3,895 $ (507) $ 9,408
(1)
At December 31,2010, includes approximately 90percent prime bonds, eight percent Alt-A bonds and two percent subprime bonds. At December 31, 2009, includes approximately 85 percent prime bonds, 10 percent Alt-A bonds and
five percent subprime bonds.
(2)
Classified in other assets on the Corporation’s Consolidated Balance Sheet.
At December 31, 2010, the accumulated net unrealized gains on AFS debt
securities included in accumulated OCI were $714 million, net of the related
income tax expense of $415 million. At December 31, 2010 and 2009, the
Corporation had nonperforming AFS debt securities of $44 million and
$467 million.
At December 31, 2010, both the amortized cost and fair value of HTM
debt securities were $427 million. At December 31, 2009, the amortized cost
and fair value of HTM debt securities were $9.8 billion and $9.7 billion, which
included ABS that were issued by the Corporation’s credit card securitization
trust and retained by the Corporation with an amortized cost of $6.6 billion
and a fair value of $6.4 billion. As a result of the adoption of new consolidation
guidance, the Corporation consolidated the credit card securitization trusts on
January 1, 2010 and the ABS were eliminated in consolidation and the related
consumer credit card loans were included in loans and leases on the
Corporation’s Consolidated Balance Sheet. Additionally, during the three
months ended June 30, 2010, $2.9 billion of debt securities held in consol-
idated commercial paper conduits was reclassified from HTM to AFS as a
result of new regulatory capital requirements related to asset-backed com-
mercial paper conduits.
Bank of America 2010 165