Bank of America 2010 Annual Report Download - page 77
Download and view the complete annual report
Please find page 77 of the 2010 Bank of America annual report below. You can navigate through the pages in the report by either clicking on the pages listed below, or by using the keyword search tool below to find specific information within the annual report.-
 1
1 -
2
-
3
-
4
-
5
-
6
-
7
-
8
-
9
-
10
-
11
-
12
-
13
-
14
-
15
-
16
-
17
-
18
-
19
-
20
-
21
-
22
-
23
-
24
-
25
-
26
-
27
-
28
-
29
-
30
-
31
-
32
-
33
-
34
-
35
-
36
-
37
-
38
-
39
-
40
-
41
-
42
-
43
-
44
-
45
-
46
-
47
-
48
-
49
-
50
-
51
-
52
-
53
-
54
-
55
-
56
-
57
-
58
-
59
-
60
-
61
-
62
-
63
-
64
-
65
-
66
-
 67
67 -
 68
68 -
 69
69 -
 70
70 -
 71
71 -
 72
72 -
 73
73 -
 74
74 -
 75
75 -
 76
76 -
 77
77 -
 78
78 -
 79
79 -
 80
80 -
 81
81 -
 82
82 -
 83
83 -
 84
84 -
 85
85 -
 86
86 -
 87
87 -
88
-
89
-
90
-
91
-
92
-
93
-
94
-
95
-
96
-
97
-
98
-
99
-
100
-
101
-
102
-
103
-
104
-
105
-
106
-
107
-
108
-
109
-
110
-
111
-
112
-
113
-
114
-
115
-
116
-
117
-
118
-
119
-
120
-
121
-
122
-
123
-
124
-
125
-
126
-
127
-
128
-
129
-
130
-
131
-
132
-
133
-
134
-
135
-
136
-
137
-
138
-
139
-
140
-
141
-
142
-
143
-
144
-
145
-
146
-
147
-
148
-
149
-
150
-
151
-
152
-
153
-
154
-
155
-
156
-
157
-
158
-
159
-
160
-
161
-
162
-
163
-
164
-
165
-
166
-
167
-
168
-
169
-
170
-
171
-
172
-
173
-
174
-
175
-
176
-
177
-
178
-
179
-
180
-
181
-
182
-
183
-
184
-
185
-
186
-
187
-
188
-
189
-
190
-
191
-
192
-
193
-
194
-
195
-
196
-
197
-
198
-
199
-
200
-
201
-
202
-
203
-
204
-
205
-
206
-
207
-
208
-
209
-
210
-
211
-
212
-
213
-
214
-
215
-
216
-
217
-
218
-
219
-
220
-
221
-
222
-
223
-
224
-
225
-
226
-
227
-
228
-
229
-
230
-
231
-
232
-
233
-
234
-
235
-
236
-
237
-
238
-
239
-
240
-
241
-
242
-
243
-
244
-
245
-
246
-
247
-
248
-
249
-
250
-
251
-
252
 |
 |
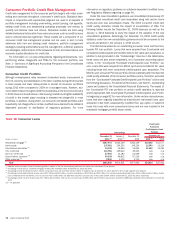
Credit Risk Management
Credit quality continued to show improvement during 2010; although, net
charge-offs, and nonperforming loans, leases and foreclosed properties re-
mained elevated. Signs of economic stability and our proactive credit risk
management initiatives positively impacted the credit portfolio as charge-offs
and delinquencies continued to improve across almost all portfolios along with
risk rating improvements in the commercial portfolio. Global and national
economic uncertainty, regulatory initiatives and reform, however, continued
to weigh on the credit portfolios through December 31, 2010. For more
information, see 2010 Economic and Business Environment on page 29. Credit
metrics were also impacted by loans added to the balance sheet on January 1,
2010 in connection with the adoption of new consolidation guidance.
Credit risk is the risk of loss arising from the inability of a borrower or
counterparty to meet its obligations. Credit risk can also arise from opera-
tional failures that result in an erroneous advance, commitment or investment
of funds. We define the credit exposure to a borrower or counterparty as the
loss potential arising from all product classifications including loans and
leases, deposit overdrafts, derivatives, assets held-for-sale and unfunded
lending commitments which include loan commitments, letters of credit and
financial guarantees. Derivative positions are recorded at fair value and
assets held-for-sale are recorded at fair value or the lower of cost or fair
value. Certain loans and unfunded commitments are accounted for under the
fair value option. Credit risk for these categories of assets is not accounted
for as part of the allowance for credit losses but as part of the fair value
adjustments recorded in earnings. For derivative positions, our credit risk is
measured as the net replacement cost in the event the counterparties with
contracts in which we are in a gain position fail to perform under the terms of
those contracts. We use the current mark-to-market value to represent credit
exposure without giving consideration to future mark-to-market changes. The
credit risk amounts take into consideration the effects of legally enforceable
master netting agreements and cash collateral. Our consumer and commer-
cial credit extension and review procedures take into account funded and
unfunded credit exposures. For additional information on derivative and credit
extension commitments, see Note 4 – Derivatives and Note 14 – Commit-
ments and Contingencies to the Consolidated Financial Statements.
We manage credit risk based on the risk profile of the borrower or
counterparty, repayment sources, the nature of underlying collateral, and
other support given current events, conditions and expectations. We classify
our portfolios as either consumer or commercial and monitor credit risk in
each as discussed below.
We proactively refine our underwriting and credit management practices,
as well as credit standards, to meet the changing economic environment. To
actively mitigate losses and enhance customer support in our consumer
businesses, we have expanded collections, loan modification and customer
assistance infrastructures. We also have implemented a number of actions to
mitigate losses in the commercial businesses including increasing the fre-
quency and intensity of portfolio monitoring, hedging activity and our practice
of transferring management of deteriorating commercial exposures to inde-
pendent special asset officers as credits approach criticized levels.
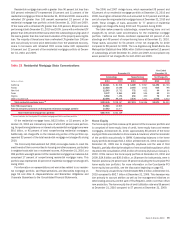
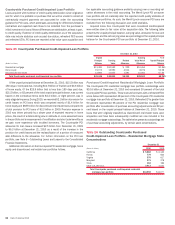
Since January 2008, and through 2010, Bank of America and Countrywide
have completed nearly 775,000 loan modifications with customers. During
2010, we completed nearly 285,000 customer loan modifications with a total
unpaid principal balance of approximately $65.7 billion, which included
109,000 customers who converted from trial period to permanent modifica-
tions under the government’s MHA program. Of the loan modifications
completed in 2010, in terms of both the volume of modifications and the
unpaid principal balance associated with the underlying loans, most were in
the portfolio serviced for investors and were not on our balance sheet. The
most common types of modifications during the year include a combination of
rate reduction and capitalization of past due amounts which represent 68 per-
cent of the volume of modifications completed in 2010, while principal
forbearance represented 15 percent and capitalization of past due amounts
represented nine percent. We also provide rate reductions, rate and payment
extensions, principal forgiveness and other actions. These modification types
are generally considered troubled debt restructurings (TDRs). For more infor-
mation on TDRs and portfolio impacts, see Nonperforming Consumer Loans
and Foreclosed Properties Activity beginning on page 85 and Note 6 – Out-
standing Loans and Leases to the Consolidated Financial Statements.
On October 1, 2010, we voluntarily stopped taking residential mortgage
foreclosure proceedings to judgment in judicial states. On October 8, 2010,
we stopped foreclosure sales in all states in order to complete an assess-
ment of the related business processes. As a result of that assessment, we
identified and began implementing process and control enhancements and
we intend to monitor ongoing quality results of each process. After these
enhancements were put in place, we resumed foreclosure sales in most non-
judicial states during the fourth quarter of 2010, and expect sales to resume
in the remaining non-judicial states in the first quarter of 2011. The process of
preparing affidavits in pending proceedings in judicial states is expected to
continue into the first quarter of 2011 and could result in prolonged adversary
proceedings that delay certain foreclosure sales. We took these precaution-
ary steps in order to ensure our processes for handling foreclosures include
the appropriate controls and quality assurance. These initiatives further
support our credit risk management and mitigation efforts. For more infor-
mation, see Recent Events beginning on page 37.
Certain European countries, including Greece, Ireland, Italy, Portugal and
Spain, continue to experience varying degrees of financial stress. Risks and
ongoing concerns about the debt crisis in Europe could result in a disruption of
the financial markets which could have a detrimental impact on the global
economic recovery, including the impact of non-sovereign debt in these
countries. For more information on our direct sovereign and non-sovereign
exposures in these countries, see Non-U.S. Portfolio beginning on page 98.
The Financial Accounting Standards Board (FASB) issued new disclosure
guidance, effective on a prospective basis for the Corporation’s 2010 year-
end reporting, that addresses disclosure of loans and other financing receiv-
ables and the related allowance. The new disclosure guidance defines a
portfolio segment as the level at which an entity develops and documents a
systematic methodology to determine the allowance for credit losses, and a
class of financing receivables as the level of disaggregation of portfolio
segments based on the initial measurement attribute, risk characteristics
and methods for assessing risk. The Corporation’s portfolio segments are
home loans, credit card and other consumer, and commercial. The classes
within the home loans portfolio segment are residential mortgage, home
equity and discontinued real estate. The classes within the credit card and
other consumer portfolio segment are U.S. credit card, non-U.S. credit card,
direct/indirect consumer and other consumer. The classes within the com-
mercial portfolio segment are U.S. commercial, commercial real estate,
commercial lease financing, non-U.S. commercial and U.S. small business
commercial. Under this new disclosure guidance, the allowance is presented
by portfolio segment.
Bank of America 2010 75