Bank of America 2010 Annual Report Download - page 78
Download and view the complete annual report
Please find page 78 of the 2010 Bank of America annual report below. You can navigate through the pages in the report by either clicking on the pages listed below, or by using the keyword search tool below to find specific information within the annual report.-
 1
1 -
2
-
3
-
4
-
5
-
6
-
7
-
8
-
9
-
10
-
11
-
12
-
13
-
14
-
15
-
16
-
17
-
18
-
19
-
20
-
21
-
22
-
23
-
24
-
25
-
26
-
27
-
28
-
29
-
30
-
31
-
32
-
33
-
34
-
35
-
36
-
37
-
38
-
39
-
40
-
41
-
42
-
43
-
44
-
45
-
46
-
47
-
48
-
49
-
50
-
51
-
52
-
53
-
54
-
55
-
56
-
57
-
58
-
59
-
60
-
61
-
62
-
63
-
64
-
65
-
66
-
67
-
 68
68 -
 69
69 -
 70
70 -
 71
71 -
 72
72 -
 73
73 -
 74
74 -
 75
75 -
 76
76 -
 77
77 -
 78
78 -
 79
79 -
 80
80 -
 81
81 -
 82
82 -
 83
83 -
 84
84 -
 85
85 -
 86
86 -
 87
87 -
 88
88 -
89
-
90
-
91
-
92
-
93
-
94
-
95
-
96
-
97
-
98
-
99
-
100
-
101
-
102
-
103
-
104
-
105
-
106
-
107
-
108
-
109
-
110
-
111
-
112
-
113
-
114
-
115
-
116
-
117
-
118
-
119
-
120
-
121
-
122
-
123
-
124
-
125
-
126
-
127
-
128
-
129
-
130
-
131
-
132
-
133
-
134
-
135
-
136
-
137
-
138
-
139
-
140
-
141
-
142
-
143
-
144
-
145
-
146
-
147
-
148
-
149
-
150
-
151
-
152
-
153
-
154
-
155
-
156
-
157
-
158
-
159
-
160
-
161
-
162
-
163
-
164
-
165
-
166
-
167
-
168
-
169
-
170
-
171
-
172
-
173
-
174
-
175
-
176
-
177
-
178
-
179
-
180
-
181
-
182
-
183
-
184
-
185
-
186
-
187
-
188
-
189
-
190
-
191
-
192
-
193
-
194
-
195
-
196
-
197
-
198
-
199
-
200
-
201
-
202
-
203
-
204
-
205
-
206
-
207
-
208
-
209
-
210
-
211
-
212
-
213
-
214
-
215
-
216
-
217
-
218
-
219
-
220
-
221
-
222
-
223
-
224
-
225
-
226
-
227
-
228
-
229
-
230
-
231
-
232
-
233
-
234
-
235
-
236
-
237
-
238
-
239
-
240
-
241
-
242
-
243
-
244
-
245
-
246
-
247
-
248
-
249
-
250
-
251
-
252
 |
 |

Consumer Portfolio Credit Risk Management
Credit risk management for the consumer portfolio begins with initial under-
writing and continues throughout a borrower’s credit cycle. Statistical tech-
niques in conjunction with experiential judgment are used in all aspects of
portfolio management including underwriting, product pricing, risk appetite,
setting credit limits and establishing operating processes and metrics to
quantify and balance risks and returns. Statistical models are built using
detailed behavioral information from external sources such as credit bureaus
and/or internal historical experience. These models are a component of our
consumer credit risk management process and are used, in part, to help
determine both new and existing credit decisions, portfolio management
strategies including authorizations and line management, collection practices
and strategies, determination of the allowance for loan and lease losses, and
economic capital allocations for credit risk.
For information on our accounting policies regarding delinquencies, non-
performing status, charge-offs and TDRs for the consumer portfolio, see
Note 1 – Summary of Significant Accounting Principles to the Consolidated
Financial Statements.
Consumer Credit Portfolio
Although unemployment rates remained at elevated levels, improvement in
the U.S. economy and stabilization in the labor markets during 2010 resulted
in lower losses and lower delinquencies in almost all consumer portfolios
during 2010 when compared to 2009 on a managed basis. However, eco-
nomic deterioration throughout 2009 and weakness in the economic recovery
in 2010 drove continued stress in the housing markets and tighter availability
of credit in the market place resulting in elevated net charge-offs in most
portfolios. In addition, during 2010, our consumer real estate portfolios were
impacted by net charge-offs on certain modified loans deemed to be collateral
dependent pursuant to clarification of regulatory guidance. For more
information on regulatory guidance on collateral dependent modified loans,
see Regulatory Matters beginning on page 60.
Under the new consolidation guidance, we consolidated all previously off-
balance sheet securitized credit card receivables along with certain home
equity and auto loan securitization trusts. The 2010 consumer credit card
credit quality statistics include the impact of consolidation of VIEs. The
following tables include the December 31, 2009 balances as well as the
January 1, 2010 balances to show the impact of the adoption of the new
consolidation guidance. Accordingly, the December 31, 2010 credit quality
statistics under the new consolidation guidance should be compared to the
amounts presented in the January 1, 2010 column.
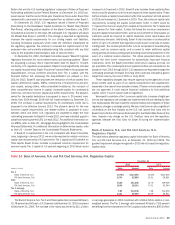
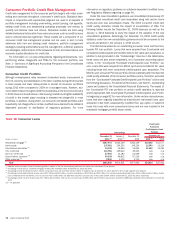
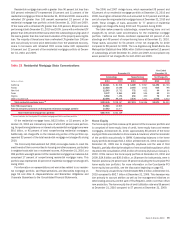
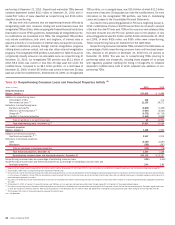
The table below presents our outstanding consumer loans and the Coun-
trywide PCI loan portfolio. Loans that were acquired from Countrywide and
considered credit-impaired were written down to fair value upon acquisition. In
addition to being included in the “Outstandings” columns in the table below,
these loans are also shown separately, net of purchase accounting adjust-
ments, in the “Countrywide Purchased Credit-impaired Loan Portfolio” col-
umn. Loans that were acquired from Merrill Lynch were recorded at fair value
including those that were considered credit-impaired upon acquisition. The
Merrill Lynch consumer PCI loan portfolio did not materially alter the reported
credit quality statistics of the consumer portfolios and is, therefore, excluded
from the “Countrywide Purchased Credit-impaired Loan Portfolio” column and
the following discussion. For additional information, see Note 6 – Outstanding
Loans and Leases to the Consolidated Financial Statements. The impact of
the Countrywide PCI loan portfolio on certain credit statistics is reported
where appropriate. See Countrywide Purchased Credit-impaired Loan Portfo-
lio beginning on page 82 for more information. Under certain circumstances,
loans that were originally classified as discontinued real estate loans upon
acquisition have been subsequently modified from pay option or subprime
loans into loans with more conventional terms and are now included in the
residential mortgage portfolio shown below.
Table 18 Consumer Loans
(Dollars in millions)
December 31
2010
(1)
January 1
2010
(1)
December 31
2009 2010
(1)
2009
December 31
Outstandings
Countrywide
Purchased
Credit-impaired Loan
Portfolio
Residential mortgage
(2)
$257,973
$242,129 $242,129
$10,592
$11,077
Home equity
137,981
154,202 149,126
12,590
13,214
Discontinued real estate
(3)
13,108
14,854 14,854
11,652
13,250
U.S. credit card
113,785
129,642 49,453
n/a
n/a
Non-U.S. credit card
27,465
31,182 21,656
n/a
n/a
Direct/Indirect consumer
(4)
90,308
99,812 97,236
n/a
n/a
Other consumer
(5)
2,830
3,110 3,110
n/a
n/a
Total
$643,450
$674,931 $577,564
$34,834
$37,541
(1)
Balances reflect the impact of new consolidation guidance. Adoption of the new consolidation guidance did not impact the Countrywide PCI loan portfolio.
(2)
Outstandings include non-U.S. residential mortgages of $90 million and $552 million at December 31, 2010 and 2009.
(3)
Outstandings include $11.8 billion and $13.4 billion of pay option loans and $1.3 billion and $1.5 billion of subprime loans at December 31, 2010 and 2009. We no longer originate these products.
(4)
Outstandings include dealer financial services loans of $42.9 billion and $41.6 billion, consumer lending loans of $12.9 billion and $19.7 billion, U.S. securities-based lending margin loans of $16.6 billion and $12.9 billion, student
loans of $6.8 billion and $10.8 billion, non-U.S. consumer loans of $8.0 billion and $8.0 billion and other consumer loans of $3.1 billion and $4.2 billion at December 31, 2010 and 2009, respectively.
(5)
Outstandings include consumer finance loans of $1.9 billion and $2.3 billion, other non-U.S. consumer loans of $803 million and $709 million and consumer overdrafts of $88 million and $144 million at December 31, 2010 and
2009.
n/a = not applicable
76 Bank of America 2010