Bank of America 2010 Annual Report Download - page 227
Download and view the complete annual report
Please find page 227 of the 2010 Bank of America annual report below. You can navigate through the pages in the report by either clicking on the pages listed below, or by using the keyword search tool below to find specific information within the annual report.-
 1
1 -
2
-
3
-
4
-
5
-
6
-
7
-
8
-
9
-
10
-
11
-
12
-
13
-
14
-
15
-
16
-
17
-
18
-
19
-
20
-
21
-
22
-
23
-
24
-
25
-
26
-
27
-
28
-
29
-
30
-
31
-
32
-
33
-
34
-
35
-
36
-
37
-
38
-
39
-
40
-
41
-
42
-
43
-
44
-
45
-
46
-
47
-
48
-
49
-
50
-
51
-
52
-
53
-
54
-
55
-
56
-
57
-
58
-
59
-
60
-
61
-
62
-
63
-
64
-
65
-
66
-
67
-
68
-
69
-
70
-
71
-
72
-
73
-
74
-
75
-
76
-
77
-
78
-
79
-
80
-
81
-
82
-
83
-
84
-
85
-
86
-
87
-
88
-
89
-
90
-
91
-
92
-
93
-
94
-
95
-
96
-
97
-
98
-
99
-
100
-
101
-
102
-
103
-
104
-
105
-
106
-
107
-
108
-
109
-
110
-
111
-
112
-
113
-
114
-
115
-
116
-
117
-
118
-
119
-
120
-
121
-
122
-
123
-
124
-
125
-
126
-
127
-
128
-
129
-
130
-
131
-
132
-
133
-
134
-
135
-
136
-
137
-
138
-
139
-
140
-
141
-
142
-
143
-
144
-
145
-
146
-
147
-
148
-
149
-
150
-
151
-
152
-
153
-
154
-
155
-
156
-
157
-
158
-
159
-
160
-
161
-
162
-
163
-
164
-
165
-
166
-
167
-
168
-
169
-
170
-
171
-
172
-
173
-
174
-
175
-
176
-
177
-
178
-
179
-
180
-
181
-
182
-
183
-
184
-
185
-
186
-
187
-
188
-
189
-
190
-
191
-
192
-
193
-
194
-
195
-
196
-
197
-
198
-
199
-
200
-
201
-
202
-
203
-
204
-
205
-
206
-
207
-
208
-
209
-
210
-
211
-
212
-
213
-
214
-
215
-
216
-
 217
217 -
 218
218 -
 219
219 -
 220
220 -
 221
221 -
 222
222 -
 223
223 -
 224
224 -
 225
225 -
 226
226 -
 227
227 -
 228
228 -
 229
229 -
 230
230 -
 231
231 -
 232
232 -
 233
233 -
 234
234 -
 235
235 -
 236
236 -
 237
237 -
238
-
239
-
240
-
241
-
242
-
243
-
244
-
245
-
246
-
247
-
248
-
249
-
250
-
251
-
252
 |
 |
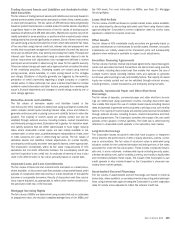
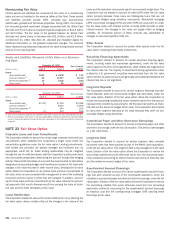
Trading Account Assets and Liabilities and Available-for-Sale
Debt Securities
The fair values of trading account assets and liabilities are primarily based on
actively traded markets where prices are based on either direct market quotes
or observed transactions. The fair values of AFS debt securities are generally
based on quoted market prices or market prices for similar assets. Liquidity is
a significant factor in the determination of the fair values of trading account
assets and liabilities and AFS debt securities. Market price quotes may not be
readily available for some positions, or positions within a market sector where
trading activity has slowed significantly or ceased. Some of these instruments
are valued using a discounted cash flow model, which estimates the fair value
of the securities using internal credit risk, interest rate and prepayment risk
models that incorporate management’s best estimate of current key assump-
tions such as default rates, loss severity and prepayment rates. Principal and
interest cash flows are discounted using an observable discount rate for
similar instruments with adjustments that management believes a market
participant would consider in determining fair value for the specific security.
Others are valued using a net asset value approach which considers the value
of the underlying securities. Underlying assets are valued using external
pricing services, where available, or matrix pricing based on the vintages
and ratings. Situations of illiquidity generally are triggered by the market’s
perception of credit uncertainty regarding a single company or a specific
market sector. In these instances, fair value is determined based on limited
available market information and other factors, principally from reviewing the
issuer’s financial statements and changes in credit ratings made by one or
more ratings agencies.
Derivative Assets and Liabilities
The fair values of derivative assets and liabilities traded in the
over-the-counter (OTC) market are determined using quantitative models that
utilize multiple market inputs including interest rates, prices and indices to
generate continuous yield or pricing curves and volatility factors to value the
position. The majority of market inputs are actively quoted and can be
validated through external sources, including brokers, market transactions
and third-party pricing services. Estimation risk is greater for derivative asset
and liability positions that are either option-based or have longer maturity
dates where observable market inputs are less readily available or are
unobservable, in which case, quantitative-based extrapolations of rate, price
or index scenarios are used in determining fair values. The fair values of
derivative assets and liabilities include adjustments for market liquidity,
counterparty credit quality and other deal specific factors, where appropriate.
The Corporation incorporates within its fair value measurements of OTC
derivatives the net credit differential between the counterparty credit risk
and the Corporation’s own credit risk. An estimate of severity of loss is also
used in the determination of fair value, primarily based on market data.
Corporate Loans and Loan Commitments
The fair values of loans and loan commitments are based on market prices,
where available, or discounted cash flow analyses using market-based credit
spreads of comparable debt instruments or credit derivatives of the specific
borrower or comparable borrowers. Results of discounted cash flow calcula-
tions may be adjusted, as appropriate, to reflect other market conditions or
the perceived credit risk of the borrower.
Mortgage Servicing Rights
The fair values of MSRs are determined using models that rely on estimates
of prepayment rates, the resultant weighted-average lives of the MSRs and
the OAS levels. For more information on MSRs, see Note 25 – Mortgage
Servicing Rights.
Loans Held-for-Sale
The fair values of LHFS are based on quoted market prices, where available,
or are determined by discounting estimated cash flows using interest rates
approximating the Corporation’s current origination rates for similar loans
adjusted to reflect the inherent credit risk.
Other Assets
The fair values of AFS marketable equity securities are generally based on
quoted market prices or market prices for similar assets. However, non-public
investments are initially valued at the transaction price and subsequently
adjusted when evidence is available to support such adjustments.
Securities Financing Agreements
The fair values of certain reverse repurchase agreements, repurchase agree-
ments and securities borrowed transactions are determined using quantita-
tive models, including discounted cash flow models that require the use of
multiple market inputs including interest rates and spreads to generate
continuous yield or pricing curves, and volatility factors. The majority of market
inputs are actively quoted and can be validated through external sources,
including brokers, market transactions and third-party pricing services.
Deposits, Commercial Paper and Other Short-term
Borrowings
The fair values of deposits, commercial paper and other short-term borrow-
ings are determined using quantitative models, including discounted cash
flow models that require the use of multiple market inputs including interest
rates and spreads to generate continuous yield or pricing curves, and volatility
factors. The majority of market inputs are actively quoted and can be validated
through external sources, including brokers, market transactions and third-
party pricing services. The Corporation considers the impact of its own credit
spreads in the valuation of these liabilities. The credit risk is determined by
reference to observable credit spreads in the secondary cash market.
Long-term Borrowings
The Corporation issues structured notes that have coupons or repayment
terms linked to the performance of debt or equity securities, indices, curren-
cies or commodities. The fair value of structured notes is estimated using
valuation models for the combined derivative and debt portions of the notes
accounted for under the fair value option. These models incorporate observ-
able and, in some instances, unobservable inputs including security prices,
interest rate yield curves, option volatility, currency, commodity or equity rates
and correlations between these inputs. The impact of the Corporation’s own
credit spreads is also included based on the Corporation’s observed sec-
ondary bond market spreads.
Asset-backed Secured Financings
The fair values of asset-backed secured financings are based on external
broker bids, where available, or are determined by discounting estimated cash
flows using interest rates approximating the Corporation’s current origination
rates for similar loans adjusted to reflect the inherent credit risk.
Bank of America 2010 225