Bank of America 2010 Annual Report Download - page 146
Download and view the complete annual report
Please find page 146 of the 2010 Bank of America annual report below. You can navigate through the pages in the report by either clicking on the pages listed below, or by using the keyword search tool below to find specific information within the annual report.-
 1
1 -
2
-
3
-
4
-
5
-
6
-
7
-
8
-
9
-
10
-
11
-
12
-
13
-
14
-
15
-
16
-
17
-
18
-
19
-
20
-
21
-
22
-
23
-
24
-
25
-
26
-
27
-
28
-
29
-
30
-
31
-
32
-
33
-
34
-
35
-
36
-
37
-
38
-
39
-
40
-
41
-
42
-
43
-
44
-
45
-
46
-
47
-
48
-
49
-
50
-
51
-
52
-
53
-
54
-
55
-
56
-
57
-
58
-
59
-
60
-
61
-
62
-
63
-
64
-
65
-
66
-
67
-
68
-
69
-
70
-
71
-
72
-
73
-
74
-
75
-
76
-
77
-
78
-
79
-
80
-
81
-
82
-
83
-
84
-
85
-
86
-
87
-
88
-
89
-
90
-
91
-
92
-
93
-
94
-
95
-
96
-
97
-
98
-
99
-
100
-
101
-
102
-
103
-
104
-
105
-
106
-
107
-
108
-
109
-
110
-
111
-
112
-
113
-
114
-
115
-
116
-
117
-
118
-
119
-
120
-
121
-
122
-
123
-
124
-
125
-
126
-
127
-
128
-
129
-
130
-
131
-
132
-
133
-
134
-
135
-
 136
136 -
 137
137 -
 138
138 -
 139
139 -
 140
140 -
 141
141 -
 142
142 -
 143
143 -
 144
144 -
 145
145 -
 146
146 -
 147
147 -
 148
148 -
 149
149 -
 150
150 -
 151
151 -
 152
152 -
 153
153 -
 154
154 -
 155
155 -
 156
156 -
157
-
158
-
159
-
160
-
161
-
162
-
163
-
164
-
165
-
166
-
167
-
168
-
169
-
170
-
171
-
172
-
173
-
174
-
175
-
176
-
177
-
178
-
179
-
180
-
181
-
182
-
183
-
184
-
185
-
186
-
187
-
188
-
189
-
190
-
191
-
192
-
193
-
194
-
195
-
196
-
197
-
198
-
199
-
200
-
201
-
202
-
203
-
204
-
205
-
206
-
207
-
208
-
209
-
210
-
211
-
212
-
213
-
214
-
215
-
216
-
217
-
218
-
219
-
220
-
221
-
222
-
223
-
224
-
225
-
226
-
227
-
228
-
229
-
230
-
231
-
232
-
233
-
234
-
235
-
236
-
237
-
238
-
239
-
240
-
241
-
242
-
243
-
244
-
245
-
246
-
247
-
248
-
249
-
250
-
251
-
252
 |
 |

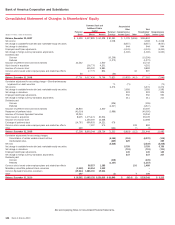
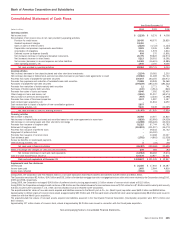
Bank of America Corporation and Subsidiaries
Consolidated Statement of Changes in Shareholders’ Equity
(Dollars in millions, shares in thousands)
Preferred
Stock Shares Amount
Retained
Earnings
Accumulated
Other
Comprehensive
Income (Loss) Other
Total
Shareholders’
Equity
Comprehensive
Income (Loss)
Common Stock and
Additional Paid-in
Capital
Balance, December 31, 2007 $ 4,409 4,437,885 $ 60,328 $ 81,393 $ 1,129 $(456) $146,803
Net income 4,008 4,008 $ 4,008
Net change in available-for-sale debt and marketable equity securities (8,557) (8,557) (8,557)
Net change in derivatives 944 944 944
Employee benefit plan adjustments (3,341) (3,341) (3,341)
Net change in foreign currency translation adjustments (1,000) (1,000) (1,000)
Dividends paid:
Common (10,256) (10,256)
Preferred (1,272) (1,272)
Issuance of preferred stock and stock warrants 33,242 1,500 34,742
Stock issued in acquisition 106,776 4,201 4,201
Issuance of common stock 455,000 9,883 9,883
Common stock issued under employee plans and related tax effects 17,775 854 43 897
Other 50 (50) –
Balance, December 31, 2008
37,701 5,017,436 76,766 73,823 (10,825) (413) 177,052 (7,946)
Cumulative adjustment for accounting change – Other-than-temporary
impairments on debt securities 71 (71) – (71)
Net income 6,276 6,276 6,276
Net change in available-for-sale debt and marketable equity securities 3,593 3,593 3,593
Net change in derivatives 923 923 923
Employee benefit plan adjustments 550 550 550
Net change in foreign currency translation adjustments 211 211 211
Dividends paid:
Common (326) (326)
Preferred (4,537) (4,537)
Issuance of preferred stock and stock warrants 26,800 3,200 30,000
Repayment of preferred stock (41,014) (3,986) (45,000)
Issuance of Common Equivalent Securities 19,244 19,244
Stock issued in acquisition 8,605 1,375,476 20,504 29,109
Issuance of common stock 1,250,000 13,468 13,468
Exchange of preferred stock (14,797) 999,935 14,221 576 –
Common stock issued under employee plans and related tax effects 7,397 575 308 883
Other 669 (664) (7) (2)
Balance, December 31, 2009
37,208 8,650,244 128,734 71,233 (5,619) (112) 231,444 11,482
Cumulative adjustments for accounting changes:
Consolidation of certain variable interest entities
(6,154) (116) (6,270) (116)
Credit-related notes
(229) 229 – 229
Net loss
(2,238) (2,238) (2,238)
Net change in available-for-sale debt and marketable equity securities
5,759 5,759 5,759
Net change in derivatives
(701) (701) (701)
Employee benefit plan adjustments
145 145 145
Net change in foreign currency translation adjustments
237 237 237
Dividends paid:
Common
(405) (405)
Preferred
(1,357) (1,357)
Common stock issued under employee plans and related tax effects
98,557 1,385 103 1,488
Mandatory convertible preferred stock conversion
(1,542) 50,354 1,542 –
Common Equivalent Securities conversion
(19,244) 1,286,000 19,244 –
Other
140 (1) 7 146
Balance, December 31, 2010 $ 16,562 10,085,155 $150,905 $ 60,849 $ (66) $ (2) $228,248 $ 3,315
See accompanying Notes to Consolidated Financial Statements.
144 Bank of America 2010