Bank of America 2010 Annual Report Download - page 217
Download and view the complete annual report
Please find page 217 of the 2010 Bank of America annual report below. You can navigate through the pages in the report by either clicking on the pages listed below, or by using the keyword search tool below to find specific information within the annual report.-
 1
1 -
2
-
3
-
4
-
5
-
6
-
7
-
8
-
9
-
10
-
11
-
12
-
13
-
14
-
15
-
16
-
17
-
18
-
19
-
20
-
21
-
22
-
23
-
24
-
25
-
26
-
27
-
28
-
29
-
30
-
31
-
32
-
33
-
34
-
35
-
36
-
37
-
38
-
39
-
40
-
41
-
42
-
43
-
44
-
45
-
46
-
47
-
48
-
49
-
50
-
51
-
52
-
53
-
54
-
55
-
56
-
57
-
58
-
59
-
60
-
61
-
62
-
63
-
64
-
65
-
66
-
67
-
68
-
69
-
70
-
71
-
72
-
73
-
74
-
75
-
76
-
77
-
78
-
79
-
80
-
81
-
82
-
83
-
84
-
85
-
86
-
87
-
88
-
89
-
90
-
91
-
92
-
93
-
94
-
95
-
96
-
97
-
98
-
99
-
100
-
101
-
102
-
103
-
104
-
105
-
106
-
107
-
108
-
109
-
110
-
111
-
112
-
113
-
114
-
115
-
116
-
117
-
118
-
119
-
120
-
121
-
122
-
123
-
124
-
125
-
126
-
127
-
128
-
129
-
130
-
131
-
132
-
133
-
134
-
135
-
136
-
137
-
138
-
139
-
140
-
141
-
142
-
143
-
144
-
145
-
146
-
147
-
148
-
149
-
150
-
151
-
152
-
153
-
154
-
155
-
156
-
157
-
158
-
159
-
160
-
161
-
162
-
163
-
164
-
165
-
166
-
167
-
168
-
169
-
170
-
171
-
172
-
173
-
174
-
175
-
176
-
177
-
178
-
179
-
180
-
181
-
182
-
183
-
184
-
185
-
186
-
187
-
188
-
189
-
190
-
191
-
192
-
193
-
194
-
195
-
196
-
197
-
198
-
199
-
200
-
201
-
202
-
203
-
204
-
205
-
206
-
 207
207 -
 208
208 -
 209
209 -
 210
210 -
 211
211 -
 212
212 -
 213
213 -
 214
214 -
 215
215 -
 216
216 -
 217
217 -
 218
218 -
 219
219 -
 220
220 -
 221
221 -
 222
222 -
 223
223 -
 224
224 -
 225
225 -
 226
226 -
 227
227 -
228
-
229
-
230
-
231
-
232
-
233
-
234
-
235
-
236
-
237
-
238
-
239
-
240
-
241
-
242
-
243
-
244
-
245
-
246
-
247
-
248
-
249
-
250
-
251
-
252
 |
 |

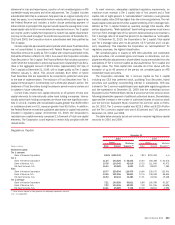
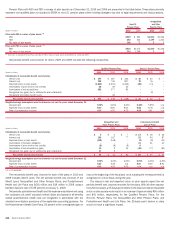
The table below summarizes the changes in the fair value of plan assets,
changes in the projected benefit obligation (PBO), the funded status of both
the accumulated benefit obligation (ABO) and the PBO, and the weighted-
average assumptions used to determine benefit obligations for the pension
plans and postretirement plans at December 31, 2010 and 2009. Amounts
recognized at December 31, 2010 and 2009 are reflected in other assets,
and accrued expenses and other liabilities on the Consolidated Balance
Sheet. The discount rate assumption is based on a cash flow matching
technique and is subject to change each year. This technique utilizes yield
curves that are based on Aa-rated corporate bonds with cash flows that match
estimated benefit payments of each of the plans to produce the discount rate
assumptions. The asset valuation method for the Qualified Pension Plans
recognizes 60 percent of the prior year’s market gains or losses at the next
measurement date with the remaining 40 percent spread equally over the
subsequent four years.
(Dollars in millions)
2010 2009 2010 2009 2010 2009 2010 2009
Qualified
Pension Plans
(1)
Non-U.S.
Pension Plans
(1)
Nonqualified
and Other
Pension Plans
(1)
Postretirement
Health and Life Plans
(1)
Change in fair value of plan assets
Fair value, January 1
$14,527
$14,254
$1,312
$–
$2,535
$2
$113
$110
Merrill Lynch balance, January 1, 2009
–
–
–
1,025
–
2,763
–
–
Actual return on plan assets
1,835
2,238
157
177
272
(235)
13
21
Company contributions
(2)
–
–
82
61
196
261
100
92
Plan participant contributions
–
–
2
2
–
–
139
141
Benefits paid
(714)
(791)
(55)
(53)
(314)
(256)
(275)
(272)
Plan transfer
–
(1,174)
–
–
–
–
–
–
Federal subsidy on benefits paid
n/a
n/a
n/a
n/a
n/a
n/a
18
21
Foreign currency exchange rate changes
n/a
n/a
(26)
100
n/a
n/a
–
–
Fair value, December 31
$15,648
$14,527
$1,472
$1,312
$2,689
$2,535
$108
$113
Change in projected benefit obligation
Projected benefit obligation, January 1
$13,048
$13,724
$1,518
$–
$2,918
$1,258
$1,620
$1,404
Merrill Lynch balance, January 1, 2009
–
–
–
1,280
–
1,683
–
226
Service cost
397
387
30
30
3
4
14
16
Interest cost
748
740
79
76
163
167
92
93
Plan participant contributions
–
–
2
2
–
–
139
141
Plan amendments
–
37
2
–
–
–
64
–
Actuarial loss (gain)
459
89
78
75
308
62
32
(11)
Benefits paid
(714)
(791)
(55)
(53)
(314)
(256)
(275)
(272)
Plan transfer
–
(1,174)
–
–
–
–
–
–
Termination benefits
–
36
–
–
–
–
–
–
Cur tailments
–
–
–
(3)
–
–
–
–
Federal subsidy on benefits paid
n/a
n/a
n/a
n/a
n/a
n/a
18
21
Foreign currency exchange rate changes
n/a
n/a
(30)
111
–
–
–
2
Projected benefit obligation, December 31
$13,938
$13,048
$1,624
$1,518
$3,078
$2,918
$1,704
$1,620
Amount recognized, December 31
$1,710
$1,479
$ (152)
$ (206)
$ (389)
$ (383)
$(1,596)
$(1,507)
Funded status, December 31
Accumulated benefit obligation
$13,192
$12,198
$1,504
$1,401
$3,077
$2,916
n/a
n/a
Overfunded (unfunded) status of ABO
2,456
2,329
(32)
(89)
(388)
(381)
n/a
n/a
Provision for future salaries
746
850
120
117
1
2
n/a
n/a
Projected benefit obligation
13,938
13,048
1,624
1,518
3,078
2,918
$1,704
$1,620
Weighted-average assumptions, December 31
Discount rate
5.45%
5.75%
5.29%
5.40%
5.20%
5.75%
5.10%
5.75%
Rate of compensation increase
4.00
4.00
4.88
4.69
4.00
4.00
n/a
n/a
(1)
The measurement date for the Qualified Pension Plans, Non-U.S. Pension Plans, Nonqualified and Other Pension Plans, and Postretirement Health and Life Plans was December 31 of each year reported.
(2)
The Corporation’s best estimate of its contributions to be made to the Qualified Pension Plans, Non-U.S. Pension Plans, Nonqualified and Other Pension Plans, and Postretirement Health and Life Plans in 2011 is $0, $82 million,
$103 million and $121 million, respectively.
n/a = not applicable
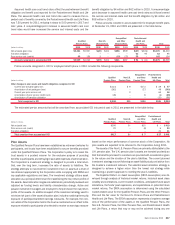
Amounts recognized in the Corporation’s Consolidated Balance Sheet at December 31, 2010 and 2009 are presented in the table below.
(Dollars in millions)
2010 2009 2010 2009 2010 2009 2010 2009
Qualified
Pension Plans
Non-U.S.
Pension Plans
Nonqualified
and Other
Pension Plans
Postretirement
Health and Life
Plans
Other assets
$1,710
$1,479
$32
$1
$809
$830
$–
$–
Accrued expenses and other liabilities
–
–
(184)
(207)
(1,198)
(1,213)
(1,596)
(1,507)
Net amount recognized at December 31
$1,710
$1,479
$ (152)
$(206)
$ (389)
$ (383)
$(1,596)
$(1,507)
Bank of America 2010 215