Bank of America 2010 Annual Report Download - page 218
Download and view the complete annual report
Please find page 218 of the 2010 Bank of America annual report below. You can navigate through the pages in the report by either clicking on the pages listed below, or by using the keyword search tool below to find specific information within the annual report.-
 1
1 -
2
-
3
-
4
-
5
-
6
-
7
-
8
-
9
-
10
-
11
-
12
-
13
-
14
-
15
-
16
-
17
-
18
-
19
-
20
-
21
-
22
-
23
-
24
-
25
-
26
-
27
-
28
-
29
-
30
-
31
-
32
-
33
-
34
-
35
-
36
-
37
-
38
-
39
-
40
-
41
-
42
-
43
-
44
-
45
-
46
-
47
-
48
-
49
-
50
-
51
-
52
-
53
-
54
-
55
-
56
-
57
-
58
-
59
-
60
-
61
-
62
-
63
-
64
-
65
-
66
-
67
-
68
-
69
-
70
-
71
-
72
-
73
-
74
-
75
-
76
-
77
-
78
-
79
-
80
-
81
-
82
-
83
-
84
-
85
-
86
-
87
-
88
-
89
-
90
-
91
-
92
-
93
-
94
-
95
-
96
-
97
-
98
-
99
-
100
-
101
-
102
-
103
-
104
-
105
-
106
-
107
-
108
-
109
-
110
-
111
-
112
-
113
-
114
-
115
-
116
-
117
-
118
-
119
-
120
-
121
-
122
-
123
-
124
-
125
-
126
-
127
-
128
-
129
-
130
-
131
-
132
-
133
-
134
-
135
-
136
-
137
-
138
-
139
-
140
-
141
-
142
-
143
-
144
-
145
-
146
-
147
-
148
-
149
-
150
-
151
-
152
-
153
-
154
-
155
-
156
-
157
-
158
-
159
-
160
-
161
-
162
-
163
-
164
-
165
-
166
-
167
-
168
-
169
-
170
-
171
-
172
-
173
-
174
-
175
-
176
-
177
-
178
-
179
-
180
-
181
-
182
-
183
-
184
-
185
-
186
-
187
-
188
-
189
-
190
-
191
-
192
-
193
-
194
-
195
-
196
-
197
-
198
-
199
-
200
-
201
-
202
-
203
-
204
-
205
-
206
-
207
-
 208
208 -
 209
209 -
 210
210 -
 211
211 -
 212
212 -
 213
213 -
 214
214 -
 215
215 -
 216
216 -
 217
217 -
 218
218 -
 219
219 -
 220
220 -
 221
221 -
 222
222 -
 223
223 -
 224
224 -
 225
225 -
 226
226 -
 227
227 -
 228
228 -
229
-
230
-
231
-
232
-
233
-
234
-
235
-
236
-
237
-
238
-
239
-
240
-
241
-
242
-
243
-
244
-
245
-
246
-
247
-
248
-
249
-
250
-
251
-
252
 |
 |

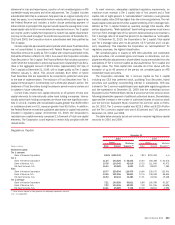
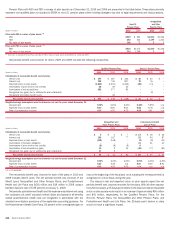
Pension Plans with ABO and PBO in excess of plan assets as of December 31, 2010 and 2009 are presented in the table below. These plans primarily
represent non-qualified plans not subject to ERISA or non-U.S. pension plans where funding strategies vary due to legal requirements and local practices.
(Dollars in millions)
2010 2009 2010 2009
Non-U.S.
Pension Plans
Nonqualified
and Other
Pension Plans
Plans with ABO in excess of plan assets
(1)
PBO
$249
$221
$1,200
$1,216
ABO
242
214
1,199
1,214
Fair value of plan assets
106
72
2
2
Plans with PBO in excess of plan assets
(1)
PBO
$414
$1,473
$1,200
$1,216
Fair value of plan assets
230
1,266
2
2
(1)
There were no Qualified Pension Plans with ABO or PBO in excess of plan assets at December 31, 2010 and 2009.
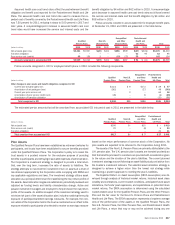
Net periodic benefit cost (income) for 2010, 2009 and 2008 included the following components.
(Dollars in millions)
2010 2009 2008 2010 2009 2008
Qualified Pension Plans Non-U.S. Pension Plans
Components of net periodic benefit cost (income)
Service cost
$397
$387 $343
$30
$30 $ –
Interest cost
748
740 837
79
76 –
Expected return on plan assets
(1,263)
(1,231) (1,444)
(88)
(74) –
Amortization of prior service cost (credits)
28
39 33
–
––
Amortization of net actuarial loss
362
377 83
–
––
Recognized loss (gain) due to settlements and curtailments
–
––
–
(2) –
Recognized termination benefit costs
–
36 –
–
––
Net periodic benefit cost (income)
$272
$ 348 $ (148)
$21
$30 $ –
Weighted-average assumptions used to determine net cost for years ended December 31
Discount rate
5.75%
6.00% 6.00%
5.40%
5.55% n/a
Expected return on plan assets
8.00
8.00 8.00
6.82
6.78 n/a
Rate of compensation increase
4.00
4.00 4.00
4.69
4.61 n/a
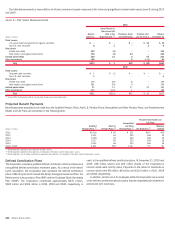
(Dollars in millions)
2010 2009 2008 2010 2009 2008
Nonqualified and
Other Pension Plans
Postretirement Health
and Life Plans
Components of net periodic benefit cost (income)
Service cost
$3
$4 $7
$14
$16 $16
Interest cost
163
167 77
92
93 87
Expected return on plan assets
(138)
(148) –
(9)
(8) (13)
Amortization of transition obligation
–
––
31
31 31
Amortization of prior service cost (credits)
(8)
(8) (8)
6
––
Amortization of net actuarial loss (gain)
10
514
(49)
(77) (81)
Recognized loss (gain) due to settlements and curtailments
17
2–
–
––
Net periodic benefit cost (income)
$47
$22 $90
$85
$55 $40
Weighted-average assumptions used to determine net cost for years ended December 31
Discount rate
5.75%
6.00% 6.00%
5.75%
6.00% 6.00%
Expected return on plan assets
5.25
5.25 n/a
8.00
8.00 8.00
Rate of compensation increase
4.00
4.00 4.00
n/a
n/a n/a
n/a = not applicable
The net periodic benefit cost (income) for each of the plans in 2010 and
2009 includes Merrill Lynch. The net periodic benefit cost (income) of the
Merrill Lynch Nonqualified and Other Pension Plans, and Postretirement
Health and Life Plans was $(20) million and $18 million in 2009 using a
blended discount rate of 5.59 percent at January 1, 2009.
Net periodic postretirement health and life expense was determined using
the “projected unit credit” actuarial method. Gains and losses for all benefits
except postretirement health care are recognized in accordance with the
standard amortization provisions of the applicable accounting guidance. For
the Postretirement Health Care Plans, 50 percent of the unrecognized gain or
loss at the beginning of the fiscal year (or at subsequent remeasurement) is
recognized on a level basis during the year.
The discount rate and expected return on plan assets impact the net
periodic benefit cost (income) recorded for the plans. With all other assump-
tions held constant, a 25-basis point decline in the discount rate and expected
return on plan assets would result in an increase of approximately $50 million
and $41 million, respectively, for the Qualified Pension Plans. For the
Non-U.S. Pension Plans, the Nonqualified and Other Pension Plans, and
Postretirement Health and Life Plans, the 25-basis point decline in rates
would not have a significant impact.
216 Bank of America 2010