Bank of America 2010 Annual Report Download - page 103
Download and view the complete annual report
Please find page 103 of the 2010 Bank of America annual report below. You can navigate through the pages in the report by either clicking on the pages listed below, or by using the keyword search tool below to find specific information within the annual report.-
 1
1 -
2
-
3
-
4
-
5
-
6
-
7
-
8
-
9
-
10
-
11
-
12
-
13
-
14
-
15
-
16
-
17
-
18
-
19
-
20
-
21
-
22
-
23
-
24
-
25
-
26
-
27
-
28
-
29
-
30
-
31
-
32
-
33
-
34
-
35
-
36
-
37
-
38
-
39
-
40
-
41
-
42
-
43
-
44
-
45
-
46
-
47
-
48
-
49
-
50
-
51
-
52
-
53
-
54
-
55
-
56
-
57
-
58
-
59
-
60
-
61
-
62
-
63
-
64
-
65
-
66
-
67
-
68
-
69
-
70
-
71
-
72
-
73
-
74
-
75
-
76
-
77
-
78
-
79
-
80
-
81
-
82
-
83
-
84
-
85
-
86
-
87
-
88
-
89
-
90
-
91
-
92
-
 93
93 -
 94
94 -
 95
95 -
 96
96 -
 97
97 -
 98
98 -
 99
99 -
 100
100 -
 101
101 -
 102
102 -
 103
103 -
 104
104 -
 105
105 -
 106
106 -
 107
107 -
 108
108 -
 109
109 -
 110
110 -
 111
111 -
 112
112 -
 113
113 -
114
-
115
-
116
-
117
-
118
-
119
-
120
-
121
-
122
-
123
-
124
-
125
-
126
-
127
-
128
-
129
-
130
-
131
-
132
-
133
-
134
-
135
-
136
-
137
-
138
-
139
-
140
-
141
-
142
-
143
-
144
-
145
-
146
-
147
-
148
-
149
-
150
-
151
-
152
-
153
-
154
-
155
-
156
-
157
-
158
-
159
-
160
-
161
-
162
-
163
-
164
-
165
-
166
-
167
-
168
-
169
-
170
-
171
-
172
-
173
-
174
-
175
-
176
-
177
-
178
-
179
-
180
-
181
-
182
-
183
-
184
-
185
-
186
-
187
-
188
-
189
-
190
-
191
-
192
-
193
-
194
-
195
-
196
-
197
-
198
-
199
-
200
-
201
-
202
-
203
-
204
-
205
-
206
-
207
-
208
-
209
-
210
-
211
-
212
-
213
-
214
-
215
-
216
-
217
-
218
-
219
-
220
-
221
-
222
-
223
-
224
-
225
-
226
-
227
-
228
-
229
-
230
-
231
-
232
-
233
-
234
-
235
-
236
-
237
-
238
-
239
-
240
-
241
-
242
-
243
-
244
-
245
-
246
-
247
-
248
-
249
-
250
-
251
-
252
 |
 |
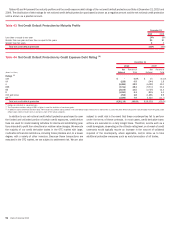
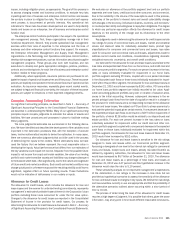
Allowance for Credit Losses
Allowance for Loan and Lease Losses
The allowance for loan and lease losses is allocated based on two compo-
nents, described below, based on whether a loan or lease is performing or
whether it has been individually identified as being impaired or has been
modified as a TDR. We evaluate the adequacy of the allowance for loan and
lease losses based on the total of these two components. The allowance for
loan and lease losses excludes loans held-for-sale and loans accounted for
under the fair value option, as fair value adjustments related to loans
measured at fair value include a credit risk component.
The first component of the allowance for loan and lease losses covers
nonperforming commercial loans, consumer real estate loans that have been
modified in a TDR, renegotiated credit card, unsecured consumer and small
business loans. These loans are subject to impairment measurement prima-
rily at the loan level based either on the present value of expected future cash
flows discounted at the loan’s original effective interest rate, or discounted at
the portfolio average contractual annual percentage rate, excluding renego-
tiated and promotionally priced loans for the renegotiated TDR portfolio.
Impairment measurement may also be based upon the collateral value or the
loan’s observable market price. When the determined or measured values are
lower than the carrying value of the loan, impairment is recognized. For
purposes of computing this specific loss component of the allowance, larger
impaired loans are evaluated individually and smaller impaired loans are
evaluated as a pool using historical loss experience for the respective product
types and risk ratings of the loans.
The second component of the allowance for loan and lease losses covers
performing consumer and commercial loans and leases which have incurred
losses that are not yet individually identifiable. The allowance for consumer
and certain homogeneous commercial loan and lease products is based on
aggregated portfolio evaluations, generally by product type. Loss forecast
models are utilized that consider a variety of factors including, but not limited
to, historical loss experience, estimated defaults or foreclosures based on
portfolio trends, delinquencies, economic trends and credit scores. Our
consumer real estate loss forecast model estimates the portion of our
homogeneous loans that will default based on individual loan attributes,
the most significant of which are refreshed LTV or CLTV, borrower credit score
as well as vintage and geography, all of which are further broken down into
current delinquency status. Incorporating refreshed LTV and CLTV into our
probability of default allows us to factor the impact of changes in home prices
into our allowance for loan and lease losses. These loss forecast models are
updated on a quarterly basis to incorporate information reflecting the current
economic environment. Included within this second component of the allow-
ance for loan and lease losses and determined separately from the proce-
dures outlined above are reserves which are maintained to cover uncertain-
ties that affect our estimate of probable losses including domestic and global
economic uncertainty and large single name defaults. We evaluate the ad-
equacy of the allowance for loan and lease losses based on the combined
total of these two components. As of December 31, 2010, inputs to the loss
forecast process resulted in reductions in the allowance for most consumer
portfolios.
The allowance for commercial loan and lease losses is established by
product type after analyzing historical loss experience by internal risk rating,
current economic conditions, industry performance trends, geographic or
obligor concentrations within each portfolio segment, and any other pertinent
information. The statistical models for commercial loans are generally up-
dated annually and utilize the Corporation’s historical database of actual
defaults and other data. The loan risk ratings and composition of the com-
mercial portfolios are updated at least quarterly to incorporate the most
recent data reflecting the current economic environment. For risk-rated com-
mercial loans, we estimate the probability of default (PD) and the loss given
default (LGD) based on the Corporation’s historical experience of defaults and
credit losses. Factors considered when assessing the internal risk rating
include the value of the underlying collateral, if applicable; the industry in
which the obligor operates; the obligor’s liquidity and other financial indica-
tors; and other quantitative and qualitative factors relevant to the obligor’s
credit risk. When estimating the allowance for loan and lease losses, man-
agement relies not only on models derived from historical experience but also
on its judgment in considering the effect on probable losses inherent in the
portfolios due to the current macroeconomic environment and trends, inher-
ent uncertainty in models, and other qualitative factors. As of December 31,
2010, updates to the loan risk ratings and composition resulted in reductions
in the allowance for all commercial portfolios.
We monitor differences between estimated and actual incurred loan and
lease losses. This monitoring process includes periodic assessments by
senior management of loan and lease portfolios and the models used to
estimate incurred losses in those portfolios.
Additions to, or reductions of, the allowance for loan and lease losses
generally are recorded through charges or credits to the provision for credit
losses. Credit exposures deemed to be uncollectible are charged against the
allowance for loan and lease losses. Recoveries of previously charged off
amounts are credited to the allowance for loan and lease losses.
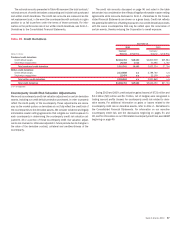
The allowance for loan and lease losses for the consumer portfolio as
presented in Table 51 was $34.7 billion at December 31, 2010, an increase
of $6.9 billion from December 31, 2009. This increase was primarily related
to $10.8 billion of reserves recorded on January 1, 2010 in connection with
the adoption of new consolidation guidance, and higher reserve additions in
the non-impaired consumer real estate portfolios during the first half of 2010
amid continued stress in the housing market. These items were partially
offset by reserve reductions primarily due to improving credit quality in the
Global Card Services consumer portfolios. With respect to the consumer PCI
loan portfolios, updates to our expected principal cash flows resulted in an
increase in reserves through provision of $2.2 billion for 2010, primarily in the
home equity and discontinued real estate portfolios compared to $3.5 billion
in 2009.
The allowance for commercial loan and lease losses was $7.2 billion at
December 31, 2010, a $2.2 billion decrease from December 31, 2009. The
decrease was primarily due to improvements in the U.S. small business
commercial portfolio within Global Card Services due to improved delinquen-
cies and bankruptcies, as well as in the U.S. commercial portfolios primarily in
Global Commercial Banking and GBAM, and the commercial real estate
portfolio primarily within Global Commercial Banking reflecting improved bor-
rower credit profiles as a result of improving economic conditions.
The allowance for loan and lease losses as a percentage of total loans and
leases outstanding was 4.47 percent at December 31, 2010 compared to
4.16 percent at December 31, 2009. The increase in the ratio was mostly due
to consumer reserve increases for securitized loans consolidated under the
new consolidation guidance, which were primarily credit card loans. The
December 31, 2010 and 2009 ratios above include the impact of the PCI
loan portfolio. Excluding the PCI loan portfolio, the allowance for loan and
lease losses as a percentage of total loans and leases outstanding was
3.94 percent at December 31, 2010 compared to 3.88 percent at Decem-
ber 31, 2009.
Reserve for Unfunded Lending Commitments
In addition to the allowance for loan and lease losses, we also estimate
probable losses related to unfunded lending commitments such as letters of
credit, financial guarantees and binding loan commitments, excluding com-
mitments accounted for under the fair value option. Unfunded lending com-
mitments are subject to the same assessment as funded loans, including
estimates of PD and LGD. Due to the nature of unfunded commitments, the
Bank of America 2010 101