Bank of America 2010 Annual Report Download - page 55
Download and view the complete annual report
Please find page 55 of the 2010 Bank of America annual report below. You can navigate through the pages in the report by either clicking on the pages listed below, or by using the keyword search tool below to find specific information within the annual report.-
 1
1 -
2
-
3
-
4
-
5
-
6
-
7
-
8
-
9
-
10
-
11
-
12
-
13
-
14
-
15
-
16
-
17
-
18
-
19
-
20
-
21
-
22
-
23
-
24
-
25
-
26
-
27
-
28
-
29
-
30
-
31
-
32
-
33
-
34
-
35
-
36
-
37
-
38
-
39
-
40
-
41
-
42
-
43
-
44
-
 45
45 -
 46
46 -
 47
47 -
 48
48 -
 49
49 -
 50
50 -
 51
51 -
 52
52 -
 53
53 -
 54
54 -
 55
55 -
 56
56 -
 57
57 -
 58
58 -
 59
59 -
 60
60 -
 61
61 -
 62
62 -
 63
63 -
 64
64 -
 65
65 -
66
-
67
-
68
-
69
-
70
-
71
-
72
-
73
-
74
-
75
-
76
-
77
-
78
-
79
-
80
-
81
-
82
-
83
-
84
-
85
-
86
-
87
-
88
-
89
-
90
-
91
-
92
-
93
-
94
-
95
-
96
-
97
-
98
-
99
-
100
-
101
-
102
-
103
-
104
-
105
-
106
-
107
-
108
-
109
-
110
-
111
-
112
-
113
-
114
-
115
-
116
-
117
-
118
-
119
-
120
-
121
-
122
-
123
-
124
-
125
-
126
-
127
-
128
-
129
-
130
-
131
-
132
-
133
-
134
-
135
-
136
-
137
-
138
-
139
-
140
-
141
-
142
-
143
-
144
-
145
-
146
-
147
-
148
-
149
-
150
-
151
-
152
-
153
-
154
-
155
-
156
-
157
-
158
-
159
-
160
-
161
-
162
-
163
-
164
-
165
-
166
-
167
-
168
-
169
-
170
-
171
-
172
-
173
-
174
-
175
-
176
-
177
-
178
-
179
-
180
-
181
-
182
-
183
-
184
-
185
-
186
-
187
-
188
-
189
-
190
-
191
-
192
-
193
-
194
-
195
-
196
-
197
-
198
-
199
-
200
-
201
-
202
-
203
-
204
-
205
-
206
-
207
-
208
-
209
-
210
-
211
-
212
-
213
-
214
-
215
-
216
-
217
-
218
-
219
-
220
-
221
-
222
-
223
-
224
-
225
-
226
-
227
-
228
-
229
-
230
-
231
-
232
-
233
-
234
-
235
-
236
-
237
-
238
-
239
-
240
-
241
-
242
-
243
-
244
-
245
-
246
-
247
-
248
-
249
-
250
-
251
-
252
 |
 |

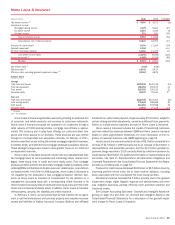
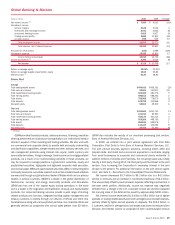
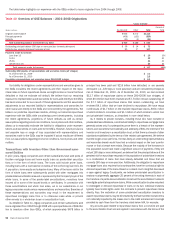
GWIM results include the impact of migrating clients and their related
deposit and loan balances to or from Deposits,Home Loans & Insurance and
the ALM portfolio as presented in the table below. The directional shift of total
deposits migrated was mainly due to client segmentation threshold changes.
Subsequent to the date of migration, the associated net interest income,
noninterest income and noninterest expense are recorded in the business to
which the clients migrated.
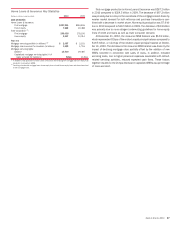
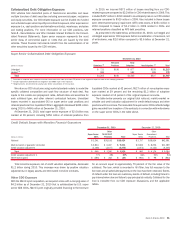
Migration Summary
(Dollars in millions)
2010 2009
Average
Total deposits – GWIM from (to) Deposits
$3,086
$(30,638)
Total loans – GWIM to Home Loans & Insurance and the
ALM portfolio
(1,405)
(12,033)
Year end
Total deposits – GWIM from (to) Deposits
$7,232
$(42,521)
Total loans – GWIM to Home Loans & Insurance and the
ALM portfolio
(1,625)
(17,241)
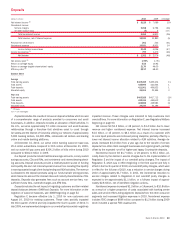
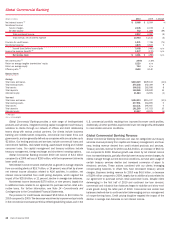
Net income decreased $369 million, or 22 percent, to $1.3 billion driven
in part by higher noninterest expense, the tax-related effect of the sale of the
Columbia Management long-term asset management business and lower net
interest income, partially offset by higher noninterest income and lower credit
costs. Net interest income decreased $157 million, or three percent, to
$5.8 billion as the positive impact of higher deposit levels was more than
offset by lower revenue from corporate ALM activity. Noninterest income
increased $691 million, or seven percent, to $10.8 billion primarily due to
higher asset management fees driven by stronger markets, continued long-
term assets under management flows and higher transactional activity. Pro-
vision for credit losses decreased $415 million, or 39 percent, to $646 million
driven by stabilization of the portfolios and the recognition of a single large
commercial charge-off in 2009. Noninterest expense increased $1.2 billion,
or 10 percent, to $13.6 billion driven by increases in revenue-related ex-
penses, higher support costs and personnel costs associated with further
investment in the business.
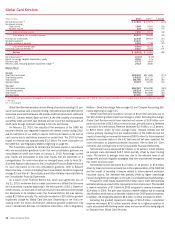
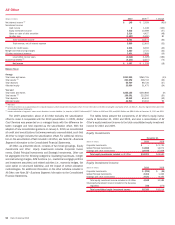
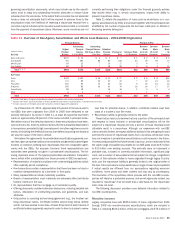
Client Balances
The table below presents client balances which consist of assets under
management, client brokerage assets, assets in custody, client deposits,
and loans and leases.
Client Balances by Type
(Dollars in millions)
2010 2009
December 31
Assets under management
$ 643,955
$749,851
Client brokerage assets
(1)
1,480,231
1,402,977
Assets in custody
126,203
144,012
Client deposits
266,444
224,839
Loans and leases
101,020
99,571
Less: Client brokerage assets, assets in custody
and deposits included in assets under
management
(379,310)
(348,738)
Total client balances
(2)
$2,238,543
$2,272,512
(1)
Client brokerage assets include non-discretionary brokerage and fee-based assets.
(2)
2009 balance includes the Columbia Management long-term asset management business representing
$114.6 billion, net of eliminations, which was sold on May 1, 2010.
The decrease in client balances was due to the sale of the Columbia
Management long-term asset management business, outflows in MLGWM’s
non-fee based brokerage assets and outflows in BACM’s money market
assets due to the continued low rate environment, partially offset by higher
market levels and inflows in client deposits, long-term assets under man-
agement (AUM) and fee-based brokerage assets.
Bank of America 2010 53