Bank of America 2010 Annual Report Download - page 88
Download and view the complete annual report
Please find page 88 of the 2010 Bank of America annual report below. You can navigate through the pages in the report by either clicking on the pages listed below, or by using the keyword search tool below to find specific information within the annual report.-
 1
1 -
2
-
3
-
4
-
5
-
6
-
7
-
8
-
9
-
10
-
11
-
12
-
13
-
14
-
15
-
16
-
17
-
18
-
19
-
20
-
21
-
22
-
23
-
24
-
25
-
26
-
27
-
28
-
29
-
30
-
31
-
32
-
33
-
34
-
35
-
36
-
37
-
38
-
39
-
40
-
41
-
42
-
43
-
44
-
45
-
46
-
47
-
48
-
49
-
50
-
51
-
52
-
53
-
54
-
55
-
56
-
57
-
58
-
59
-
60
-
61
-
62
-
63
-
64
-
65
-
66
-
67
-
68
-
69
-
70
-
71
-
72
-
73
-
74
-
75
-
76
-
77
-
 78
78 -
 79
79 -
 80
80 -
 81
81 -
 82
82 -
 83
83 -
 84
84 -
 85
85 -
 86
86 -
 87
87 -
 88
88 -
 89
89 -
 90
90 -
 91
91 -
 92
92 -
 93
93 -
 94
94 -
 95
95 -
 96
96 -
 97
97 -
 98
98 -
99
-
100
-
101
-
102
-
103
-
104
-
105
-
106
-
107
-
108
-
109
-
110
-
111
-
112
-
113
-
114
-
115
-
116
-
117
-
118
-
119
-
120
-
121
-
122
-
123
-
124
-
125
-
126
-
127
-
128
-
129
-
130
-
131
-
132
-
133
-
134
-
135
-
136
-
137
-
138
-
139
-
140
-
141
-
142
-
143
-
144
-
145
-
146
-
147
-
148
-
149
-
150
-
151
-
152
-
153
-
154
-
155
-
156
-
157
-
158
-
159
-
160
-
161
-
162
-
163
-
164
-
165
-
166
-
167
-
168
-
169
-
170
-
171
-
172
-
173
-
174
-
175
-
176
-
177
-
178
-
179
-
180
-
181
-
182
-
183
-
184
-
185
-
186
-
187
-
188
-
189
-
190
-
191
-
192
-
193
-
194
-
195
-
196
-
197
-
198
-
199
-
200
-
201
-
202
-
203
-
204
-
205
-
206
-
207
-
208
-
209
-
210
-
211
-
212
-
213
-
214
-
215
-
216
-
217
-
218
-
219
-
220
-
221
-
222
-
223
-
224
-
225
-
226
-
227
-
228
-
229
-
230
-
231
-
232
-
233
-
234
-
235
-
236
-
237
-
238
-
239
-
240
-
241
-
242
-
243
-
244
-
245
-
246
-
247
-
248
-
249
-
250
-
251
-
252
 |
 |

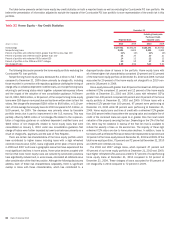
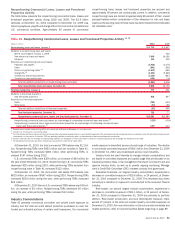
performing at December 31, 2010. Discontinued real estate TDRs deemed
collateral dependent totaled $213 million at December 31, 2010 and in-
cluded $97 million of loans classified as nonperforming and $116 million
classified as performing.
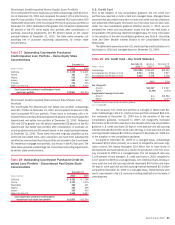
We also work with customers that are experiencing financial difficulty by
renegotiating credit card, consumer lending and small business loans (the
renegotiated TDR portfolio), while complying with Federal Financial Institutions
Examination Council (FFIEC) guidelines. Substantially all renegotiated portfo-
lio modifications are considered to be TDRs. The renegotiated TDR portfolio
may include modifications, both short- and long-term, of interest rates or
payment amounts or a combination of interest rates and payment amounts.
We make modifications primarily through internal renegotiation programs
utilizing direct customer contact, but may also utilize external renegotiation
programs. The renegotiated TDR portfolio is excluded from Table 33 as we do
not generally classify consumer non-real estate loans as nonperforming. At
December 31, 2010, our renegotiated TDR portfolio was $12.1 billion of
which $9.2 billion was current or less than 30 days past due under the
modified terms, compared to an $8.1 billion portfolio, on a held basis at
December 31, 2009, of which $5.9 billion was current or less than 30 days
past due under the modified terms. At December 31, 2009, our renegotiated
TDR portfolio, on a managed basis, was $15.8 billion of which $11.5 billion
was current or less than 30 days past due under the modified terms. For more
information on the renegotiated TDR portfolio, see Note 6 – Outstanding
Loans and Leases to the Consolidated Financial Statements.
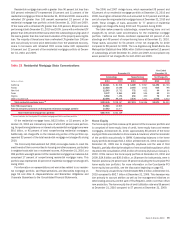
As a result of new accounting guidance on PCI loans, beginning January 1,
2010, modifications of loans in the PCI loan portfolio do not result in removal
of the loan from the PCI loan pool. TDRs in the consumer real estate portfolio
that were removed from the PCI loan portfolio prior to the adoption of new
accounting guidance were $2.1 billion and $2.3 billion at December 31, 2010
and 2009, of which $426 million and $395 million were nonperforming.
These nonperforming loans are excluded from the table below.
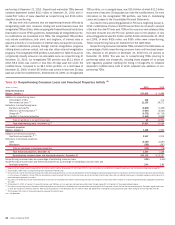
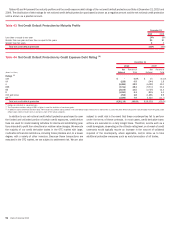
Nonperforming consumer real estate TDRs, included in the table below, as
a percentage of total nonperforming consumer loans and foreclosed proper-
ties, declined to 16 percent at December 31, 2010 from 21 percent at
December 31, 2009. This was due to nonperforming TDRs returning to
performing status and charge-offs, including those charged off to comply
with regulatory guidance clarifying the timing of charge-offs on collateral
dependent modified loans, both of which outpaced new additions of non-
performing TDRs.
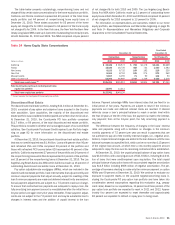
Table 33 Nonperforming Consumer Loans and Foreclosed Properties Activity
(1)
(Dollars in millions)
2010 2009
Nonperforming loans
Balance, January 1
$20,839
$9,888
Additions to nonperforming loans:
Consolidation of VIEs
448
n/a
New nonaccrual loans
(2)
21,136
29,271
Reductions in nonperforming loans:
Paydowns and payoffs
(2,809)
(1,459)
Returns to performing status
(3)
(7,647)
(4,540)
Charge-offs
(4)
(9,772)
(10,702)
Transfers to foreclosed properties
(1,341)
(1,619)
Total net additions to nonperforming loans
15
10,951
Total nonperforming loans, December 31
(5)
20,854
20,839
Foreclosed properties
Balance, January 1
1,428
1,506
Additions to foreclosed properties:
New foreclosed properties
(6, 7)
2,337
1,976
Reductions in foreclosed properties:
Sales
(2,327)
(1,687)
Write-downs
(189)
(367)
Total net reductions to foreclosed properties
(179)
(78)
Total foreclosed properties, December 31
1,249
1,428
Nonperforming consumer loans and foreclosed properties, December 31
$22,103
$22,267
Nonperforming consumer loans as a percentage of outstanding consumer loans
3.24%
3.61%
Nonperforming consumer loans and foreclosed properties as a percentage of outstanding consumer loans and
foreclosed properties
3.43
3.85
(1)
Balances do not include nonperforming LHFS of $1.0 billion and $1.6 billion at December 31, 2010 and 2009. For more information on our definition of nonperforming loans, see the discussion beginning on page 85.
(2)
2009 includes $465 million of nonperforming loans acquired from Merrill Lynch.
(3)
Consumer loans may be returned to performing status when all principal and interest is current and full repayment of the remaining contractual principal and interest is expected, or when the loan otherwise becomes well-secured and
is in the process of collection. Certain TDRs are classified as nonperforming at the time of restructure and may only be returned to performing status after considering the borrower’s sustained repayment performance for a
reasonable period, generally six months.
(4)
Our policy is not to classify consumer credit card and consumer loans not secured by real estate as nonperforming; therefore, the charge-offs on these loans have no impact on nonperforming activity and accordingly are excluded from
this table.
(5)
At December 31, 2010, 67 percent of nonperforming loans are 180 days or more past due and have been written down through charge-offs to 69 percent of the unpaid principal balance.
(6)
Our policy is to record any losses in the value of foreclosed properties as a reduction in the allowance for loan and lease losses during the first 90 days after transfer of a loan into foreclosed properties. Thereafter, all gains and losses
in value are recorded in noninterest expense. New foreclosed properties in the table above are net of $575 million and $818 million of charge-offs during 2010 and 2009, taken during the first 90 days after transfer.
(7)
2009 includes $21 million of foreclosed properties acquired from Merrill Lynch.
n/a = not applicable
86 Bank of America 2010