Bank of America 2010 Annual Report Download - page 49
Download and view the complete annual report
Please find page 49 of the 2010 Bank of America annual report below. You can navigate through the pages in the report by either clicking on the pages listed below, or by using the keyword search tool below to find specific information within the annual report.-
 1
1 -
2
-
3
-
4
-
5
-
6
-
7
-
8
-
9
-
10
-
11
-
12
-
13
-
14
-
15
-
16
-
17
-
18
-
19
-
20
-
21
-
22
-
23
-
24
-
25
-
26
-
27
-
28
-
29
-
30
-
31
-
32
-
33
-
34
-
35
-
36
-
37
-
38
-
 39
39 -
 40
40 -
 41
41 -
 42
42 -
 43
43 -
 44
44 -
 45
45 -
 46
46 -
 47
47 -
 48
48 -
 49
49 -
 50
50 -
 51
51 -
 52
52 -
 53
53 -
 54
54 -
 55
55 -
 56
56 -
 57
57 -
 58
58 -
 59
59 -
60
-
61
-
62
-
63
-
64
-
65
-
66
-
67
-
68
-
69
-
70
-
71
-
72
-
73
-
74
-
75
-
76
-
77
-
78
-
79
-
80
-
81
-
82
-
83
-
84
-
85
-
86
-
87
-
88
-
89
-
90
-
91
-
92
-
93
-
94
-
95
-
96
-
97
-
98
-
99
-
100
-
101
-
102
-
103
-
104
-
105
-
106
-
107
-
108
-
109
-
110
-
111
-
112
-
113
-
114
-
115
-
116
-
117
-
118
-
119
-
120
-
121
-
122
-
123
-
124
-
125
-
126
-
127
-
128
-
129
-
130
-
131
-
132
-
133
-
134
-
135
-
136
-
137
-
138
-
139
-
140
-
141
-
142
-
143
-
144
-
145
-
146
-
147
-
148
-
149
-
150
-
151
-
152
-
153
-
154
-
155
-
156
-
157
-
158
-
159
-
160
-
161
-
162
-
163
-
164
-
165
-
166
-
167
-
168
-
169
-
170
-
171
-
172
-
173
-
174
-
175
-
176
-
177
-
178
-
179
-
180
-
181
-
182
-
183
-
184
-
185
-
186
-
187
-
188
-
189
-
190
-
191
-
192
-
193
-
194
-
195
-
196
-
197
-
198
-
199
-
200
-
201
-
202
-
203
-
204
-
205
-
206
-
207
-
208
-
209
-
210
-
211
-
212
-
213
-
214
-
215
-
216
-
217
-
218
-
219
-
220
-
221
-
222
-
223
-
224
-
225
-
226
-
227
-
228
-
229
-
230
-
231
-
232
-
233
-
234
-
235
-
236
-
237
-
238
-
239
-
240
-
241
-
242
-
243
-
244
-
245
-
246
-
247
-
248
-
249
-
250
-
251
-
252
 |
 |

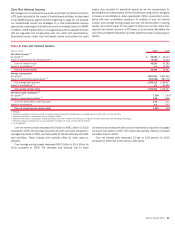
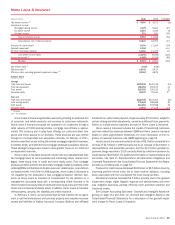
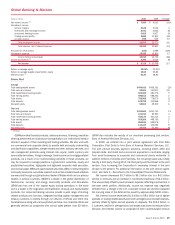
Home Loans & Insurance Key Statistics
(Dollars in millions, except as noted)
2010 2009
Loan production
Home Loans & Insurance:
First mortgage
$287,236
$354,506
Home equity
7,626
10,488
Total Corporation
(1)
:
First mortgage
298,038
378,105
Home equity
8,437
13,214
Year end
Mortgage servicing portfolio (in billions)
(2)
$2,057
$2,151
Mortgage loans serviced for investors (in billions)
1,628
1,716
Mortgage servicing rights:
Balance
14,900
19,465
Capitalized mortgage servicing rights (% of
loans serviced for investors)
92bps
113bps
(1)
In addition to loan production in Home Loans & Insurance, the remaining first mortgage and home equity loan
production is primarily in GWIM.
(2)
Servicing of residential mortgage loans, home equity lines of credit, home equity loans and discontinued real
estate mortgage loans.
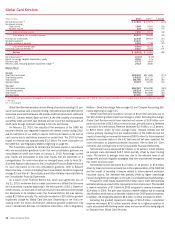
First mortgage production in Home Loans & Insurance was $287.2 billion
in 2010 compared to $354.5 billion in 2009. The decrease of $67.3 billion
was primarily due to a drop in the overall size of the mortgage market driven by
weaker market demand for both refinance and purchase transactions com-
bined with a decrease in market share. Home equity production was $7.6 bil-
lion in 2010 compared to $10.5 billion in 2009. The decrease of $2.9 billion
was primarily due to more stringent underwriting guidelines for home equity
lines of credit and loans as well as lower consumer demand.
At December 31, 2010, the consumer MSR balance was $14.9 billion,
which represented 92 bps of the related unpaid principal balance compared to
$19.5 billion, or 113 bps of the related unpaid principal balance at Decem-
ber 31, 2009. The decrease in the consumer MSR balance was driven by the
impact of declining mortgage rates partially offset by the addition of new
MSRs recorded in connection with sales of loans. In addition, elevated
servicing costs, due to higher personnel expenses associated with default-
related servicing activities, reduced expected cash flows. These factors
together resulted in the 21 bps decrease in capitalized MSRs as a percentage
of loans serviced.
Bank of America 2010 47