Bank of America 2010 Annual Report Download - page 164
Download and view the complete annual report
Please find page 164 of the 2010 Bank of America annual report below. You can navigate through the pages in the report by either clicking on the pages listed below, or by using the keyword search tool below to find specific information within the annual report.-
 1
1 -
2
-
3
-
4
-
5
-
6
-
7
-
8
-
9
-
10
-
11
-
12
-
13
-
14
-
15
-
16
-
17
-
18
-
19
-
20
-
21
-
22
-
23
-
24
-
25
-
26
-
27
-
28
-
29
-
30
-
31
-
32
-
33
-
34
-
35
-
36
-
37
-
38
-
39
-
40
-
41
-
42
-
43
-
44
-
45
-
46
-
47
-
48
-
49
-
50
-
51
-
52
-
53
-
54
-
55
-
56
-
57
-
58
-
59
-
60
-
61
-
62
-
63
-
64
-
65
-
66
-
67
-
68
-
69
-
70
-
71
-
72
-
73
-
74
-
75
-
76
-
77
-
78
-
79
-
80
-
81
-
82
-
83
-
84
-
85
-
86
-
87
-
88
-
89
-
90
-
91
-
92
-
93
-
94
-
95
-
96
-
97
-
98
-
99
-
100
-
101
-
102
-
103
-
104
-
105
-
106
-
107
-
108
-
109
-
110
-
111
-
112
-
113
-
114
-
115
-
116
-
117
-
118
-
119
-
120
-
121
-
122
-
123
-
124
-
125
-
126
-
127
-
128
-
129
-
130
-
131
-
132
-
133
-
134
-
135
-
136
-
137
-
138
-
139
-
140
-
141
-
142
-
143
-
144
-
145
-
146
-
147
-
148
-
149
-
150
-
151
-
152
-
153
-
 154
154 -
 155
155 -
 156
156 -
 157
157 -
 158
158 -
 159
159 -
 160
160 -
 161
161 -
 162
162 -
 163
163 -
 164
164 -
 165
165 -
 166
166 -
 167
167 -
 168
168 -
 169
169 -
 170
170 -
 171
171 -
 172
172 -
 173
173 -
 174
174 -
175
-
176
-
177
-
178
-
179
-
180
-
181
-
182
-
183
-
184
-
185
-
186
-
187
-
188
-
189
-
190
-
191
-
192
-
193
-
194
-
195
-
196
-
197
-
198
-
199
-
200
-
201
-
202
-
203
-
204
-
205
-
206
-
207
-
208
-
209
-
210
-
211
-
212
-
213
-
214
-
215
-
216
-
217
-
218
-
219
-
220
-
221
-
222
-
223
-
224
-
225
-
226
-
227
-
228
-
229
-
230
-
231
-
232
-
233
-
234
-
235
-
236
-
237
-
238
-
239
-
240
-
241
-
242
-
243
-
244
-
245
-
246
-
247
-
248
-
249
-
250
-
251
-
252
 |
 |

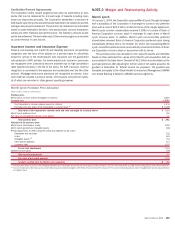
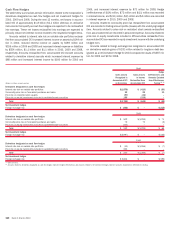
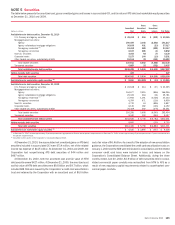
Sales and Trading Revenue
The Corporation enters into trading derivatives to facilitate client transactions,
for principal trading purposes, and to manage risk exposures arising from
trading account assets and liabilities. It is the Corporation’s policy to include
these derivative instruments in its trading activities which include derivatives
and non-derivative cash instruments. The resulting risk from these derivatives
is managed on a portfolio basis as part of the Corporation’s GBAM business
segment. The related sales and trading revenue generated within GBAM is
recorded on various income statement line items including trading account
profits (losses) and net interest income as well as other revenue categories.
However, the vast majority of income related to derivative instruments is
recorded in trading account profits (losses). The table below identifies the
amounts in the respective income statement line items attributable to the
Corporation’s sales and trading revenue categorized by primary risk for 2010,
2009 and 2008.
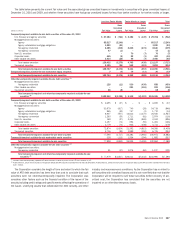
(Dollars in millions)
Trading
Account
Profits
(Losses)
Other
Revenues
(1)
Net Interest
Income Total
2010
Interest rate risk
$ 2,004 $ 113 $ 624 $ 2,741
Foreign exchange risk
903 3 – 906
Equity risk
1,670 2,506 21 4,197
Credit risk
4,791 617 3,652 9,060
Other risk
228 39 (142) 125
Total sales and trading revenue $ 9,596 $ 3,278 $4,155 $ 17,029
2009
Interest rate risk $ 3,145 $ 33 $1,068 $ 4,246
Foreign exchange risk 972 6 26 1,004
Equity risk 2,041 2,613 246 4,900
Credit risk 4,433 (2,576) 4,637 6,494
Other risk 1,084 13 (469) 628
Total sales and trading revenue
$11,675 $ 89 $5,508 $ 17,272
2008
Interest rate risk $ 1,083 $ 47 $ 276 $ 1,406
Foreign exchange risk 1,320 6 13 1,339
Equity risk (66) 686 99 719
Credit risk (8,276) (6,881) 4,380 (10,777)
Other risk 130 58 (14) 174
Total sales and trading revenue
$ (5,809) $(6,084) $4,754 $ (7,139)
(1)
Represents investment and brokerage services and other income recorded in GBAM that the Corporation includes in its definition of sales and trading revenue.
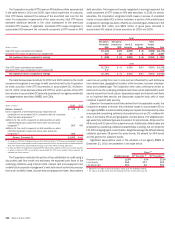
Credit Derivatives
The Corporation enters into credit derivatives primarily to facilitate client
transactions and to manage credit risk exposures. Credit derivatives derive
value based on an underlying third party-referenced obligation or a portfolio of
referenced obligations and generally require the Corporation as the seller of
credit protection to make payments to a buyer upon the occurrence of a
predefined credit event. Such credit events generally include bankruptcy of the
referenced credit entity and failure to pay under the obligation, as well as
acceleration of indebtedness and payment repudiation or moratorium. For
credit derivatives based on a portfolio of referenced credits or credit indices,
the Corporation may not be required to make payment until a specified
amount of loss has occurred and/or may only be required to make payment
up to a specified amount.
162 Bank of America 2010