Bank of America 2010 Annual Report Download - page 94
Download and view the complete annual report
Please find page 94 of the 2010 Bank of America annual report below. You can navigate through the pages in the report by either clicking on the pages listed below, or by using the keyword search tool below to find specific information within the annual report.-
 1
1 -
2
-
3
-
4
-
5
-
6
-
7
-
8
-
9
-
10
-
11
-
12
-
13
-
14
-
15
-
16
-
17
-
18
-
19
-
20
-
21
-
22
-
23
-
24
-
25
-
26
-
27
-
28
-
29
-
30
-
31
-
32
-
33
-
34
-
35
-
36
-
37
-
38
-
39
-
40
-
41
-
42
-
43
-
44
-
45
-
46
-
47
-
48
-
49
-
50
-
51
-
52
-
53
-
54
-
55
-
56
-
57
-
58
-
59
-
60
-
61
-
62
-
63
-
64
-
65
-
66
-
67
-
68
-
69
-
70
-
71
-
72
-
73
-
74
-
75
-
76
-
77
-
78
-
79
-
80
-
81
-
82
-
83
-
 84
84 -
 85
85 -
 86
86 -
 87
87 -
 88
88 -
 89
89 -
 90
90 -
 91
91 -
 92
92 -
 93
93 -
 94
94 -
 95
95 -
 96
96 -
 97
97 -
 98
98 -
 99
99 -
 100
100 -
 101
101 -
 102
102 -
 103
103 -
 104
104 -
105
-
106
-
107
-
108
-
109
-
110
-
111
-
112
-
113
-
114
-
115
-
116
-
117
-
118
-
119
-
120
-
121
-
122
-
123
-
124
-
125
-
126
-
127
-
128
-
129
-
130
-
131
-
132
-
133
-
134
-
135
-
136
-
137
-
138
-
139
-
140
-
141
-
142
-
143
-
144
-
145
-
146
-
147
-
148
-
149
-
150
-
151
-
152
-
153
-
154
-
155
-
156
-
157
-
158
-
159
-
160
-
161
-
162
-
163
-
164
-
165
-
166
-
167
-
168
-
169
-
170
-
171
-
172
-
173
-
174
-
175
-
176
-
177
-
178
-
179
-
180
-
181
-
182
-
183
-
184
-
185
-
186
-
187
-
188
-
189
-
190
-
191
-
192
-
193
-
194
-
195
-
196
-
197
-
198
-
199
-
200
-
201
-
202
-
203
-
204
-
205
-
206
-
207
-
208
-
209
-
210
-
211
-
212
-
213
-
214
-
215
-
216
-
217
-
218
-
219
-
220
-
221
-
222
-
223
-
224
-
225
-
226
-
227
-
228
-
229
-
230
-
231
-
232
-
233
-
234
-
235
-
236
-
237
-
238
-
239
-
240
-
241
-
242
-
243
-
244
-
245
-
246
-
247
-
248
-
249
-
250
-
251
-
252
 |
 |
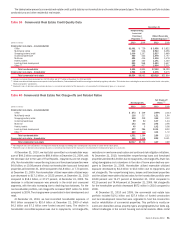
demand and cash flows, along with declining property valuations have re-
sulted in elevated levels of reservable criticized exposure, nonperforming
loans and foreclosed properties, and net charge-offs. Reservable criticized
construction and land development loans totaled $10.5 billion and $13.9 bil-
lion at December 31, 2010 and 2009. Nonperforming construction and land
development loans and foreclosed properties totaled $4.0 billion and $5.2 bil-
lion at December 31, 2010 and 2009. During a property’s construction
phase, interest income is typically paid from interest reserves that are
established at the inception of the loan. As construction is completed and
the property is put into service, these interest reserves are depleted and
interest begins to be paid from operating cash flows. Loans continue to be
classified as construction loans until they are refinanced. We do not recognize
interest income on nonperforming loans regardless of the existence of an
interest reserve.
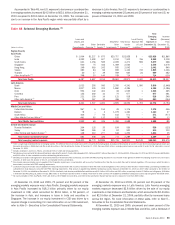
Non-U.S. Commercial
The non-U.S. commercial loan portfolio is managed primarily in GBAM. Out-
standing loans, excluding loans accounted for under the fair value option,
showed growth from client demand driven by regional economic conditions
and the positive impact of our initiatives in Asia and other emerging markets.
Net charge-offs decreased $426 million in 2010 compared to 2009 due to
stabilization in the portfolio. For additional information on the non-U.S. com-
mercial portfolio, refer to Non-U.S. Portfolio beginning on page 98.
U.S. Small Business Commercial
The U.S. small business commercial loan portfolio is comprised of business
card and small business loans managed in Global Card Services and Global
Commercial Banking. U.S. small business commercial net charge-offs de-
creased $968 million in 2010 compared to 2009. Although losses remain
elevated, the reduction in net charge-offs was driven by lower levels of
delinquencies and bankruptcies resulting from U.S. economic improvement
as well as the reduction of higher risk vintages and the impact of higher quality
originations. Of the U.S. small business commercial net charge-offs for 2010,
79 percent were credit card-related products compared to 81 percent during
2009.
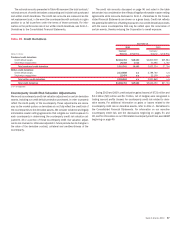
Commercial Loans Carried at Fair Value
The portfolio of commercial loans accounted for under the fair value option is
managed primarily in GBAM. Outstanding commercial loans accounted for
under the fair value option decreased $1.6 billion to an aggregate fair value of
$3.3 billion at December 31, 2010 compared to December 31, 2009 due
primarily to reduced corporate borrowings under bank credit facilities. We
recorded net losses of $89 million resulting from new originations, loans
being paid off at par value and changes in the fair value of the loan portfolio
during 2010 compared to net gains of $515 million during 2009. These
amounts were primarily attributable to changes in instrument-specific credit
risk and were largely offset by gains or losses from hedging activities.
In addition, unfunded lending commitments and letters of credit had an
aggregate fair value of $866 million and $950 million at December 31, 2010
and 2009 and were recorded in accrued expenses and other liabilities. The
associated aggregate notional amount of unfunded lending commitments and
letters of credit accounted for under the fair value option were $27.3 billion
and $27.0 billion at December 31, 2010 and 2009. Net gains resulting from
new originations, terminations and changes in the fair value of commitments
and letters of credit of $172 million were recorded during 2010 compared to
net gains of $1.4 billion for 2009. These gains were primarily attributable to
changes in instrument-specific credit risk.
92 Bank of America 2010