Bank of America 2010 Annual Report Download - page 102
Download and view the complete annual report
Please find page 102 of the 2010 Bank of America annual report below. You can navigate through the pages in the report by either clicking on the pages listed below, or by using the keyword search tool below to find specific information within the annual report.-
 1
1 -
2
-
3
-
4
-
5
-
6
-
7
-
8
-
9
-
10
-
11
-
12
-
13
-
14
-
15
-
16
-
17
-
18
-
19
-
20
-
21
-
22
-
23
-
24
-
25
-
26
-
27
-
28
-
29
-
30
-
31
-
32
-
33
-
34
-
35
-
36
-
37
-
38
-
39
-
40
-
41
-
42
-
43
-
44
-
45
-
46
-
47
-
48
-
49
-
50
-
51
-
52
-
53
-
54
-
55
-
56
-
57
-
58
-
59
-
60
-
61
-
62
-
63
-
64
-
65
-
66
-
67
-
68
-
69
-
70
-
71
-
72
-
73
-
74
-
75
-
76
-
77
-
78
-
79
-
80
-
81
-
82
-
83
-
84
-
85
-
86
-
87
-
88
-
89
-
90
-
91
-
 92
92 -
 93
93 -
 94
94 -
 95
95 -
 96
96 -
 97
97 -
 98
98 -
 99
99 -
 100
100 -
 101
101 -
 102
102 -
 103
103 -
 104
104 -
 105
105 -
 106
106 -
 107
107 -
 108
108 -
 109
109 -
 110
110 -
 111
111 -
 112
112 -
113
-
114
-
115
-
116
-
117
-
118
-
119
-
120
-
121
-
122
-
123
-
124
-
125
-
126
-
127
-
128
-
129
-
130
-
131
-
132
-
133
-
134
-
135
-
136
-
137
-
138
-
139
-
140
-
141
-
142
-
143
-
144
-
145
-
146
-
147
-
148
-
149
-
150
-
151
-
152
-
153
-
154
-
155
-
156
-
157
-
158
-
159
-
160
-
161
-
162
-
163
-
164
-
165
-
166
-
167
-
168
-
169
-
170
-
171
-
172
-
173
-
174
-
175
-
176
-
177
-
178
-
179
-
180
-
181
-
182
-
183
-
184
-
185
-
186
-
187
-
188
-
189
-
190
-
191
-
192
-
193
-
194
-
195
-
196
-
197
-
198
-
199
-
200
-
201
-
202
-
203
-
204
-
205
-
206
-
207
-
208
-
209
-
210
-
211
-
212
-
213
-
214
-
215
-
216
-
217
-
218
-
219
-
220
-
221
-
222
-
223
-
224
-
225
-
226
-
227
-
228
-
229
-
230
-
231
-
232
-
233
-
234
-
235
-
236
-
237
-
238
-
239
-
240
-
241
-
242
-
243
-
244
-
245
-
246
-
247
-
248
-
249
-
250
-
251
-
252
 |
 |

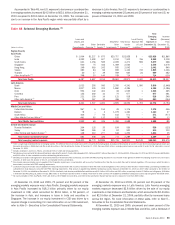
$81 million primarily driven by a decrease in securities in South Africa, offset by
increases in loans in the United Arab Emirates and South Africa, and securities
in Bahrain. At December 31, 2010 and 2009, three percent and five percent of
the emerging markets exposure was in Central and Eastern Europe.
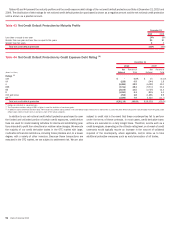
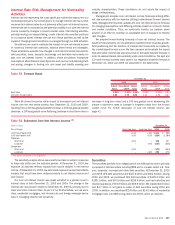
Certain European countries, including Greece, Ireland, Italy, Portugal and
Spain, are currently experiencing varying degrees of financial stress. These
countries have had certain credit ratings lowered by ratings services during
2010. Risks from the debt crisis in Europe could result in a disruption of the
financial markets which could have a detrimental impact on the global eco-
nomic recovery and sovereign and non-sovereign debt in these countries. The
table below shows our direct sovereign and non-sovereign exposures, exclud-
ing consumer credit card exposure, in these countries at December 31, 2010.
The total exposure to these countries was $15.8 billion at December 31,
2010 compared to $25.5 billion at December 31, 2009. The $9.7 billion
decrease since December 31, 2009 was driven primarily by the sale or
maturity of sovereign and non-sovereign securities in all countries.
Table 49 Selected European Countries
(Dollars in millions)
Loans and
Leases, and
Loan
Commitments
Other
Financing
(1)
Derivative
Assets
(2)
Securities/
Other
Investments
(3)
Total Cross-
border
Exposure
(4)
Local
Country
Exposure Net
of Local
Liabilities
(5)
Total Non-
U.S.
Exposure at
December 31,
2010
Credit Default
Protection
(6)
Greece
Sovereign $ – $ – $ – $ 103 $ 103 $ –
$103
$(23)
Non-sovereign 260 2 43 69 374 –
374
–
Total Greece
$ 260 $ 2 $ 43 $ 172 $ 477 $ –
$477
$(23)
Ireland
Sovereign $ 7 $ 326 $ 22 $ 52 $ 407 $ –
$407
$–
Non-sovereign 1,641 524 152 267 2,584 –
2,584
(15)
Total Ireland
$1,648 $ 850 $ 174 $ 319 $ 2,991 $ –
$2,991
$(15)
Italy
Sovereign $ – $ – $1,247 $ 21 $ 1,268 $ 1
$1,269
$(1,136)
Non-sovereign 967 639 560 1,310 3,476 1,792
5,268
(67)
Total Italy
$ 967 $ 639 $1,807 $1,331 $ 4,744 $1,793
$6,537
$(1,203)
Portugal
Sovereign $ – $ – $ 36 $ – $ 36 $ –
$36
$(19)
Non-sovereign 65 55 26 344 490 –
490
–
Total Portugal
$ 65 $ 55 $ 62 $ 344 $ 526 $ –
$526
$(19)
Spain
Sovereign $ 25 $ – $ 36 $ – $ 61 $ 40
$101
$(57)
Non-sovereign 1,028 40 382 1,872 3,322 1,835
5,157
(7)
Total Spain
$1,053 $ 40 $ 418 $1,872 $ 3,383 $1,875
$5,258
$(64)
Total
Sovereign $ 32 $ 326 $1,341 $ 176 $ 1,875 $ 41
$1,916
$(1,235)
Non-sovereign 3,961 1,260 1,163 3,862 10,246 3,627
13,873
(89)
Total selected European exposure
$3,993 $1,586 $2,504 $4,038 $12,121 $3,668
$15,789
$(1,324)
(1)
Includes acceptances, due froms, SBLCs, commercial letters of credit and formal guarantees.
(2)
Derivative assets are carried at fair value and have been reduced by the amount of cash collateral applied of $2.9 billion at December 31, 2010. At December 31, 2010, there was $41 million of other marketable securities
collateralizing derivative assets.
(3)
Generally, cross-border resale agreements are presented based on the domicile of the counterparty, consistent with FFIEC reporting requirements. Cross-border resale agreements where the underlying securities are U.S. Treasury
securities, in which case the domicile is the U.S., are excluded from this presentation.
(4)
Cross-border exposure includes amounts payable to the Corporation by borrowers or counterparties with a country of residence other than the one in which the credit is booked, regardless of the currency in which the claim is
denominated, consistent with FFIEC reporting requirements.
(5)
Local country exposure includes amounts payable to the Corporation by borrowers with a country of residence in which the credit is booked regardless of the currency in which the claim is denominated. Local funding or liabilities are
subtracted from local exposures consistent with FFIEC reporting requirements. Of the $838 million applied for exposure reduction, $459 million was in Italy, $208 million in Ireland, $137 million in Spain and $34 million in Greece.
(6)
Represents net notional credit default protection purchased to hedge counterparty risk.
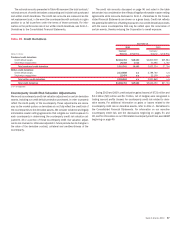
Provision for Credit Losses
The provision for credit losses decreased $20.1 billion to $28.4 billion for 2010
compared to 2009. The provision for credit losses for the consumer portfolio
decreased $11.4 billion to $25.4 billion for 2010 compared to 2009 reflecting
lower delinquencies and decreasing bankruptcies in the consumer credit card
and unsecured consumer lending portfolios resulting from an improving eco-
nomic outlook. Also contributing to the improvement were lower reserve ad-
ditions in consumer real estate due to improving portfolio trends. The addition
to reserves in the consumer PCI loan portfolios reflected further reductions in
expected principal cash flows of $2.2 billion for 2010 compared to $3.5 billion
a year earlier. Consumer net charge-offs of $29.4 billion for 2010 were
$4.2 billion higher than the prior year due to the impact of the adoption of new
consolidation guidance resulting in the consolidation of certain securitized
loan balances in our consumer credit card and home equity portfolios, offset
by benefits from economic improvement during the year which impacted all
consumer portfolios.
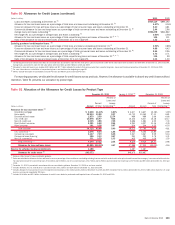
The provision for credit losses for the commercial portfolio, including the
provision for unfunded lending commitments, decreased $8.7 billion to
$3.0 billion for 2010 compared to 2009 due to improved borrower credit
profiles, stabilization of appraisal values in the commercial real estate port-
folio and lower delinquencies and bankruptcies in the small business port-
folio. These same factors resulted in a decrease in commercial net charge-
offs of $3.5 billion to $5.0 billion in 2010 compared to 2009.
100 Bank of America 2010