Bank of America 2010 Annual Report Download - page 91
Download and view the complete annual report
Please find page 91 of the 2010 Bank of America annual report below. You can navigate through the pages in the report by either clicking on the pages listed below, or by using the keyword search tool below to find specific information within the annual report.-
 1
1 -
2
-
3
-
4
-
5
-
6
-
7
-
8
-
9
-
10
-
11
-
12
-
13
-
14
-
15
-
16
-
17
-
18
-
19
-
20
-
21
-
22
-
23
-
24
-
25
-
26
-
27
-
28
-
29
-
30
-
31
-
32
-
33
-
34
-
35
-
36
-
37
-
38
-
39
-
40
-
41
-
42
-
43
-
44
-
45
-
46
-
47
-
48
-
49
-
50
-
51
-
52
-
53
-
54
-
55
-
56
-
57
-
58
-
59
-
60
-
61
-
62
-
63
-
64
-
65
-
66
-
67
-
68
-
69
-
70
-
71
-
72
-
73
-
74
-
75
-
76
-
77
-
78
-
79
-
80
-
 81
81 -
 82
82 -
 83
83 -
 84
84 -
 85
85 -
 86
86 -
 87
87 -
 88
88 -
 89
89 -
 90
90 -
 91
91 -
 92
92 -
 93
93 -
 94
94 -
 95
95 -
 96
96 -
 97
97 -
 98
98 -
 99
99 -
 100
100 -
 101
101 -
102
-
103
-
104
-
105
-
106
-
107
-
108
-
109
-
110
-
111
-
112
-
113
-
114
-
115
-
116
-
117
-
118
-
119
-
120
-
121
-
122
-
123
-
124
-
125
-
126
-
127
-
128
-
129
-
130
-
131
-
132
-
133
-
134
-
135
-
136
-
137
-
138
-
139
-
140
-
141
-
142
-
143
-
144
-
145
-
146
-
147
-
148
-
149
-
150
-
151
-
152
-
153
-
154
-
155
-
156
-
157
-
158
-
159
-
160
-
161
-
162
-
163
-
164
-
165
-
166
-
167
-
168
-
169
-
170
-
171
-
172
-
173
-
174
-
175
-
176
-
177
-
178
-
179
-
180
-
181
-
182
-
183
-
184
-
185
-
186
-
187
-
188
-
189
-
190
-
191
-
192
-
193
-
194
-
195
-
196
-
197
-
198
-
199
-
200
-
201
-
202
-
203
-
204
-
205
-
206
-
207
-
208
-
209
-
210
-
211
-
212
-
213
-
214
-
215
-
216
-
217
-
218
-
219
-
220
-
221
-
222
-
223
-
224
-
225
-
226
-
227
-
228
-
229
-
230
-
231
-
232
-
233
-
234
-
235
-
236
-
237
-
238
-
239
-
240
-
241
-
242
-
243
-
244
-
245
-
246
-
247
-
248
-
249
-
250
-
251
-
252
 |
 |

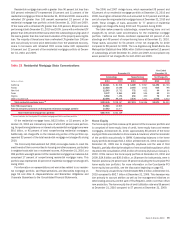
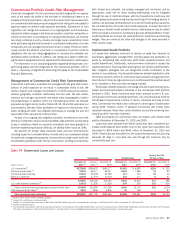
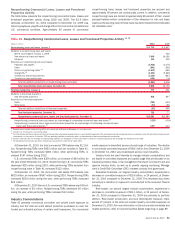
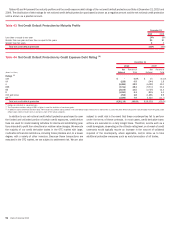
Table 37 presents commercial utilized reservable criticized exposure by
product type. Criticized exposure corresponds to the Special Mention, Sub-
standard and Doubtful asset categories as defined by regulatory authorities.
In addition to reservable loans and leases, excluding those accounted for
under the fair value option, exposure includes SBLCs, financial guarantees,
bankers’ acceptances and commercial letters of credit for which we are legally
bound to advance funds under prescribed conditions, during a specified time
period. Although funds have not been advanced, these exposure types are
considered utilized for credit risk management purposes. Total commercial
utilized reservable criticized exposure decreased $16.1 billion at Decem-
ber 31, 2010 compared to December 31, 2009, due to decreases across all
portfolios, primarily U.S. commercial and commercial real estate driven
largely by continued paydowns, payoffs and, to a diminishing extent,
charge-offs. Despite the improvements, utilized reservable criticized levels
remain elevated in commercial real estate. At December 31, 2010, approx-
imately 88 percent of the loans within commercial utilized reservable criticized
exposure were secured.
Table 37 Commercial Utilized Reservable Criticized Exposure
(Dollars in millions)
Amount Percent
(1)
Amount Percent
(1)
2010 2009
December 31
U.S. commercial
(2)
$17,195 7.44%
$28,259 11.77%
Commercial real estate
20,518 38.88
23,804 32.13
Commercial lease financing
1,188 5.41
2,229 10.04
Non-U.S. commercial
2,043 5.01
2,605 7.12
40,944 11.81
56,897 15.26
U.S. small business commercial
1,677 11.37
1,789 10.18
Total commercial utilized reservable criticized exposure
$42,621 11.80
$58,686 15.03
(1)
Percentages are calculated as commercial utilized reservable criticized exposure divided by total commercial utilized reservable exposure for each exposure category.
(2)
Excludes U.S. small business commercial exposure.
U.S. Commercial
At December 31, 2010, 57 percent and 25 percent of the U.S. commercial
loan portfolio, excluding small business, were included in Global Commercial
Banking and GBAM. The remaining 18 percent was mostly included in GWIM
(business-purpose loans for wealthy clients). Outstanding U.S. commercial
loans, excluding loans accounted for under the fair value option, decreased
$5.8 billion primarily due to reduced customer demand and continued client
utilization of the capital markets, partially offset by the adoption of new
consolidation guidance which increased loans by $5.3 billion on January 1,
2010. Compared to December 31, 2009, reservable criticized balances and
nonperforming loans and leases declined $11.1 billion and $1.5 billion. The
declines were broad-based in terms of borrowers and industries and were
driven by improved client credit profiles and liquidity. Net charge-offs de-
creased $1.3 billion in 2010 compared to 2009.
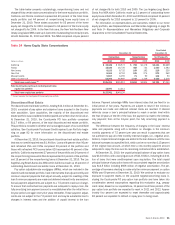
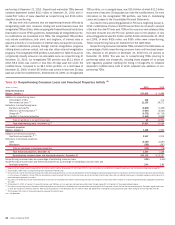
Commercial Real Estate
The commercial real estate portfolio is predominantly managed in Global
Commercial Banking and consists of loans made primarily to public and
private developers, homebuilders and commercial real estate firms. Out-
standing loans decreased $20.1 billion at December 31, 2010 compared
to December 31, 2009 due to portfolio attrition, the sale of First Republic,
transfer of certain assets to LHFS and net charge-offs. The portfolio remains
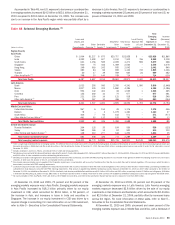
diversified across property types and geographic regions. California repre-
sents the largest state concentration at 18 percent of commercial real estate
loans and leases at December 31, 2010. For more information on geographic
and property concentrations, refer to Table 38.
Credit quality for commercial real estate is showing signs of stabilization;
however, we expect that elevated unemployment and ongoing pressure on
vacancy and rental rates will continue to affect primarily the non-homebuilder
portfolio. Compared to December 31, 2009, nonperforming commercial real
estate loans and foreclosed properties decreased in the homebuilder, retail
and land development property types, partially offset by an increase in office
and multi-use property types. Reservable criticized balances declined by
$3.3 billion primarily due to stabilization in the homebuilder portfolio and
retail and unsecured segments in the non-homebuilder portfolio, partially
offset by continued deterioration in the multi-family rental and office property
types within the non-homebuilder portfolio. Net charge-offs decreased
$685 million in 2010 compared to 2009 due to declines in the homebuilder
portfolio resulting from a slower rate of declining appraisal values.
Bank of America 2010 89