Bank of America 2010 Annual Report Download - page 48
Download and view the complete annual report
Please find page 48 of the 2010 Bank of America annual report below. You can navigate through the pages in the report by either clicking on the pages listed below, or by using the keyword search tool below to find specific information within the annual report.-
 1
1 -
2
-
3
-
4
-
5
-
6
-
7
-
8
-
9
-
10
-
11
-
12
-
13
-
14
-
15
-
16
-
17
-
18
-
19
-
20
-
21
-
22
-
23
-
24
-
25
-
26
-
27
-
28
-
29
-
30
-
31
-
32
-
33
-
34
-
35
-
36
-
37
-
 38
38 -
 39
39 -
 40
40 -
 41
41 -
 42
42 -
 43
43 -
 44
44 -
 45
45 -
 46
46 -
 47
47 -
 48
48 -
 49
49 -
 50
50 -
 51
51 -
 52
52 -
 53
53 -
 54
54 -
 55
55 -
 56
56 -
 57
57 -
 58
58 -
59
-
60
-
61
-
62
-
63
-
64
-
65
-
66
-
67
-
68
-
69
-
70
-
71
-
72
-
73
-
74
-
75
-
76
-
77
-
78
-
79
-
80
-
81
-
82
-
83
-
84
-
85
-
86
-
87
-
88
-
89
-
90
-
91
-
92
-
93
-
94
-
95
-
96
-
97
-
98
-
99
-
100
-
101
-
102
-
103
-
104
-
105
-
106
-
107
-
108
-
109
-
110
-
111
-
112
-
113
-
114
-
115
-
116
-
117
-
118
-
119
-
120
-
121
-
122
-
123
-
124
-
125
-
126
-
127
-
128
-
129
-
130
-
131
-
132
-
133
-
134
-
135
-
136
-
137
-
138
-
139
-
140
-
141
-
142
-
143
-
144
-
145
-
146
-
147
-
148
-
149
-
150
-
151
-
152
-
153
-
154
-
155
-
156
-
157
-
158
-
159
-
160
-
161
-
162
-
163
-
164
-
165
-
166
-
167
-
168
-
169
-
170
-
171
-
172
-
173
-
174
-
175
-
176
-
177
-
178
-
179
-
180
-
181
-
182
-
183
-
184
-
185
-
186
-
187
-
188
-
189
-
190
-
191
-
192
-
193
-
194
-
195
-
196
-
197
-
198
-
199
-
200
-
201
-
202
-
203
-
204
-
205
-
206
-
207
-
208
-
209
-
210
-
211
-
212
-
213
-
214
-
215
-
216
-
217
-
218
-
219
-
220
-
221
-
222
-
223
-
224
-
225
-
226
-
227
-
228
-
229
-
230
-
231
-
232
-
233
-
234
-
235
-
236
-
237
-
238
-
239
-
240
-
241
-
242
-
243
-
244
-
245
-
246
-
247
-
248
-
249
-
250
-
251
-
252
 |
 |

Mortgage Banking Income
Home Loans & Insurance mortgage banking income is categorized into
production and servicing income. Production income is comprised of revenue
from the fair value gains and losses recognized on our interest rate lock
commitments (IRLCs) and loans held-for-sale (LHFS), the related secondary
market execution, and costs related to representations and warranties in the
sales transactions along with other obligations incurred in the sales of
mortgage loans. In addition, production income includes revenue, which is
eliminated in All Other, for transfers of mortgage loans from Home Loans &
Insurance to the ALM portfolio related to the Corporation’s mortgage pro-
duction retention decisions.
Servicing income includes income earned in connection with servicing
activities and MSR valuation adjustments, net of economic hedge activities.
The costs associated with our servicing activities are included in noninterest
expense.
Servicing activities include collecting cash for principal, interest and
escrow payments from borrowers, disbursing customer draws for lines of
credit and accounting for and remitting principal and interest payments to
investors and escrow payments to third parties. Our home retention efforts
are also part of our servicing activities, along with responding to customer
inquiries and supervising foreclosures and property dispositions. In an effort
to avoid foreclosure, Bank of America evaluates various workout options prior
to foreclosure sale which has resulted in elongated default timelines. Our
servicing agreements with certain loan investors require us to comply with
usual and customar y standards in the liquidation of delinquent mortgage
loans. Our agreements with the GSEs provide timelines to complete the
liquidation of delinquent loans. In instances where we fail to meet these
timelines, our agreements provide the GSEs with the option to assess
compensatory fees. In 2010, the Corporation recorded an expense of ap-
proximately $230 million for estimated compensatory fees that it expects to
be assessed by the GSEs as a result of foreclosure delays. Additionally, we
may face demands and claims from private-label securitization investors
concerning alleged breaches of customary servicing standards. For additional
information on our servicing activities, see Recent Events – Certain Servicing-
related Issues beginning on page 38.
On October 18, 2010, Countrywide Home Loans Servicing, LP (which
changed its name to BAC Home Loans Servicing, LP), a wholly-owned sub-
sidiary of the Corporation, received a letter, in its capacity as servicer under
certain pooling and servicing agreements for 115 private-label residential
MBS securitizations (subsequently increased to 225 securitizations). The
letter asserted breaches of certain servicing obligations. For additional
information, see Recent Events – Private-label Residential Mortgage-backed
Securities Matters on page 39.
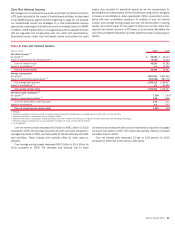
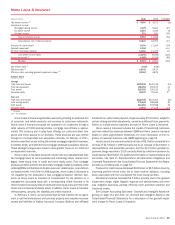
The table below summarizes the components of mortgage banking
income.
Mortgage Banking Income
(Dollars in millions)
2010 2009
Production income:
Core production revenue
$6,098
$7,352
Representations and warranties provision
(6,786)
(1,851)
Total production income (loss)
(688)
5,501
Servicing income:
Servicing fees
6,475
6,219
Impact of customer payments
(1)
(3,760)
(4,491)
Fair value changes of MSRs, net of economic hedge
results
(2)
376
1,539
Other servicing-related revenue
676
553
Total net servicing income
3,767
3,820
Total Home Loans & Insurance mortgage banking
income
3,079
9,321
Other business segments’ mortgage banking loss
(3)
(345)
(530)
Total consolidated mortgage banking income
$2,734
$8,791
(1)
Represents the change in the market value of the MSR asset due to the impact of customer payments received
during the year.
(2)
Includes sale of MSRs.
(3)
Includes the effect of transfers of mortgage loans from Home Loans & Insurance to the ALM portfolio in All
Other.
The production loss of $688 million represented a decrease of $6.2 billion
as representations and warranties provision increased $4.9 billion to
$6.8 billion which includes provision of $3.0 billion related to the GSE
agreements as well as adjustments to the representations and warranties
liability for other loans sold directly to the GSEs and not covered by those
agreements. Also contributing to the representations and warranties provi-
sion for the year was our continued evaluation of non-GSE exposure to
repurchases and similar claims, which led to the determination that we have
developed sufficient repurchase experience with certain non-GSE counter-
parties to record a liability related to existing and future projected claims from
such counterparties. For additional information on representations and war-
ranties, see Note 9 – Representations and Warranties Obligations and Cor-
porate Guarantees to the Consolidated Financial Statements, Recent
Events – Representations and Warranties Liability on page 37 and Represen-
tations and Warranties beginning on page 56. In addition, core production
revenue, which excludes representations and warranties provision, declined
$1.3 billion due to a decline in volume driven by a drop in the overall size of the
mortgage market and a decline in market share.
Net servicing income remained relatively flat as lower MSR results, net of
hedges, were offset by a lower impact of customer payments and higher fee
income. For additional information on MSRs and the related hedge instru-
ments, see Mortgage Banking Risk Management on page 110.
46 Bank of America 2010