Bank of America 2010 Annual Report Download - page 165
Download and view the complete annual report
Please find page 165 of the 2010 Bank of America annual report below. You can navigate through the pages in the report by either clicking on the pages listed below, or by using the keyword search tool below to find specific information within the annual report.-
 1
1 -
2
-
3
-
4
-
5
-
6
-
7
-
8
-
9
-
10
-
11
-
12
-
13
-
14
-
15
-
16
-
17
-
18
-
19
-
20
-
21
-
22
-
23
-
24
-
25
-
26
-
27
-
28
-
29
-
30
-
31
-
32
-
33
-
34
-
35
-
36
-
37
-
38
-
39
-
40
-
41
-
42
-
43
-
44
-
45
-
46
-
47
-
48
-
49
-
50
-
51
-
52
-
53
-
54
-
55
-
56
-
57
-
58
-
59
-
60
-
61
-
62
-
63
-
64
-
65
-
66
-
67
-
68
-
69
-
70
-
71
-
72
-
73
-
74
-
75
-
76
-
77
-
78
-
79
-
80
-
81
-
82
-
83
-
84
-
85
-
86
-
87
-
88
-
89
-
90
-
91
-
92
-
93
-
94
-
95
-
96
-
97
-
98
-
99
-
100
-
101
-
102
-
103
-
104
-
105
-
106
-
107
-
108
-
109
-
110
-
111
-
112
-
113
-
114
-
115
-
116
-
117
-
118
-
119
-
120
-
121
-
122
-
123
-
124
-
125
-
126
-
127
-
128
-
129
-
130
-
131
-
132
-
133
-
134
-
135
-
136
-
137
-
138
-
139
-
140
-
141
-
142
-
143
-
144
-
145
-
146
-
147
-
148
-
149
-
150
-
151
-
152
-
153
-
154
-
 155
155 -
 156
156 -
 157
157 -
 158
158 -
 159
159 -
 160
160 -
 161
161 -
 162
162 -
 163
163 -
 164
164 -
 165
165 -
 166
166 -
 167
167 -
 168
168 -
 169
169 -
 170
170 -
 171
171 -
 172
172 -
 173
173 -
 174
174 -
 175
175 -
176
-
177
-
178
-
179
-
180
-
181
-
182
-
183
-
184
-
185
-
186
-
187
-
188
-
189
-
190
-
191
-
192
-
193
-
194
-
195
-
196
-
197
-
198
-
199
-
200
-
201
-
202
-
203
-
204
-
205
-
206
-
207
-
208
-
209
-
210
-
211
-
212
-
213
-
214
-
215
-
216
-
217
-
218
-
219
-
220
-
221
-
222
-
223
-
224
-
225
-
226
-
227
-
228
-
229
-
230
-
231
-
232
-
233
-
234
-
235
-
236
-
237
-
238
-
239
-
240
-
241
-
242
-
243
-
244
-
245
-
246
-
247
-
248
-
249
-
250
-
251
-
252
 |
 |

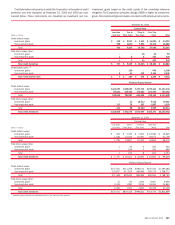
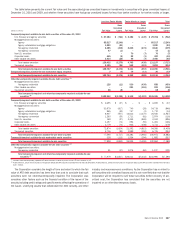
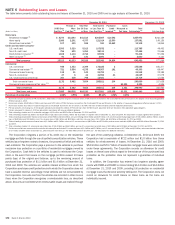
Credit derivative instruments in which the Corporation is the seller of credit
protection and their expiration at December 31, 2010 and 2009 are sum-
marized below. These instruments are classified as investment and non-
investment grade based on the credit quality of the underlying reference
obligation. The Corporation considers ratings of BBB- or higher as investment-
grade. Non-investment grade includes non-rated credit derivative instruments.
(Dollars in millions)
Less than
One Year
One to
Three Years
Three to
Five Years
Over Five
Years Total
Carrying Value
December 31, 2010
Credit default swaps:
Investment grade
$ 158 $ 2,607 $ 7,331 $ 14,880 $ 24,976
Non-investment grade
598 6,630 7,854 23,106 38,188
Total
756 9,237 15,185 37,986 63,164
Total return swaps/other:
Investment grade
– – 38 60 98
Non-investment grade
122415420
Total
1 2 40 475 518
Total credit derivatives $ 757 $ 9,239 $ 15,225 $ 38,461 $ 63,682
Credit-related notes:
(1)
Investment grade
– 136 – 949 1,085
Non-investment grade
9 33 174 2,315 2,531
Total credit-related notes $ 9 $ 169 $ 174 $ 3,264 $ 3,616
Maximum Payout/Notional
Credit default swaps:
Investment grade
$133,691 $466,565 $475,715 $275,434 $1,351,405
Non-investment grade
84,851 314,422 178,880 203,930 782,083
Total
218,542 780,987 654,595 479,364 2,133,488
Total return swaps/other:
Investment grade
– 10 15,413 4,012 19,435
Non-investment grade
113 78 951 1,897 3,039
Total
113 88 16,364 5,909 22,474
Total credit derivatives
$218,655 $781,075 $670,959 $485,273 $2,155,962
(Dollars in millions)
Less than
One Year
One to
Three Years
Three to
Five Years
Over Five
Years Tot al
Carrying Value
December 31, 2009
Credit default swaps:
Investment grade $ 454 $ 5,795 $ 5,831 $ 24,586 $ 36,666
Non-investment grade 1,342 14,012 16,081 30,274 61,709
Total 1,796 19,807 21,912 54,860 98,375
Total return swaps/other:
Investment grade 120 5540 566
Non-investment grade – 194 3 291 488
Total 1 214 8 831 1,054
Total credit derivatives
$ 1,797 $ 20,021 $ 21,920 $ 55,691 $ 99,429
Maximum Payout/Notional
Credit default swaps:
Investment grade $147,501 $411,258 $596,103 $335,526 $1,490,388
Non-investment grade 123,907 417,834 399,896 356,735 1,298,372
Total 271,408 829,092 995,999 692,261 2,788,760
Total return swaps/other:
Investment grade 31 60 1,081 8,087 9,259
Non-investment grade 2,035 1,280 2,183 18,352 23,850
Total 2,066 1,340 3,264 26,439 33,109
Total credit derivatives
$273,474 $830,432 $999,263 $718,700 $2,821,869
(1)
Maximum payout/notional for credit-related notes is the same as these amounts.
Bank of America 2010 163