Bank of America 2010 Annual Report Download - page 60
Download and view the complete annual report
Please find page 60 of the 2010 Bank of America annual report below. You can navigate through the pages in the report by either clicking on the pages listed below, or by using the keyword search tool below to find specific information within the annual report.-
 1
1 -
2
-
3
-
4
-
5
-
6
-
7
-
8
-
9
-
10
-
11
-
12
-
13
-
14
-
15
-
16
-
17
-
18
-
19
-
20
-
21
-
22
-
23
-
24
-
25
-
26
-
27
-
28
-
29
-
30
-
31
-
32
-
33
-
34
-
35
-
36
-
37
-
38
-
39
-
40
-
41
-
42
-
43
-
44
-
45
-
46
-
47
-
48
-
49
-
 50
50 -
 51
51 -
 52
52 -
 53
53 -
 54
54 -
 55
55 -
 56
56 -
 57
57 -
 58
58 -
 59
59 -
 60
60 -
 61
61 -
 62
62 -
 63
63 -
 64
64 -
 65
65 -
 66
66 -
 67
67 -
 68
68 -
 69
69 -
 70
70 -
71
-
72
-
73
-
74
-
75
-
76
-
77
-
78
-
79
-
80
-
81
-
82
-
83
-
84
-
85
-
86
-
87
-
88
-
89
-
90
-
91
-
92
-
93
-
94
-
95
-
96
-
97
-
98
-
99
-
100
-
101
-
102
-
103
-
104
-
105
-
106
-
107
-
108
-
109
-
110
-
111
-
112
-
113
-
114
-
115
-
116
-
117
-
118
-
119
-
120
-
121
-
122
-
123
-
124
-
125
-
126
-
127
-
128
-
129
-
130
-
131
-
132
-
133
-
134
-
135
-
136
-
137
-
138
-
139
-
140
-
141
-
142
-
143
-
144
-
145
-
146
-
147
-
148
-
149
-
150
-
151
-
152
-
153
-
154
-
155
-
156
-
157
-
158
-
159
-
160
-
161
-
162
-
163
-
164
-
165
-
166
-
167
-
168
-
169
-
170
-
171
-
172
-
173
-
174
-
175
-
176
-
177
-
178
-
179
-
180
-
181
-
182
-
183
-
184
-
185
-
186
-
187
-
188
-
189
-
190
-
191
-
192
-
193
-
194
-
195
-
196
-
197
-
198
-
199
-
200
-
201
-
202
-
203
-
204
-
205
-
206
-
207
-
208
-
209
-
210
-
211
-
212
-
213
-
214
-
215
-
216
-
217
-
218
-
219
-
220
-
221
-
222
-
223
-
224
-
225
-
226
-
227
-
228
-
229
-
230
-
231
-
232
-
233
-
234
-
235
-
236
-
237
-
238
-
239
-
240
-
241
-
242
-
243
-
244
-
245
-
246
-
247
-
248
-
249
-
250
-
251
-
252
 |
 |

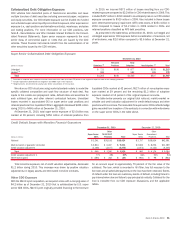
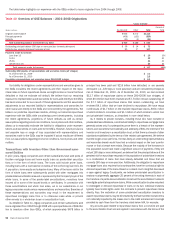
The table below highlights our experience with the GSEs related to loans originated from 2004 through 2008.
Table 10 Overview of GSE Balances – 2004–2008 Originations
(Dollars in billions)
Countrywide Other Total
Percent of
Total
Legacy Orginator
Original funded balance $846 $272
$1,118
Principal payments (406) (133)
(539)
Defaults (31) (3)
(34)
Total outstanding balance at December 31, 2010 $ 409 $ 136 $ 545
Outstanding principal balance 180 days or more past due (severely delinquent) $ 59 $ 14
$73
Defaults plus severely delinquent (principal at risk) 90 17
107
Payments made by borrower:
Less than 13
$16
15%
13-24
32
30
25-36
33
31
Greater than 36
26
24
Total payments made by borrower $ 107 100%
Outstanding GSE pipeline of representations and warranties claims (all vintages)
As of December 31, 2009
$3.3
As of December 31, 2010
2.8
Cumulative representations and warranties losses 2004-2008 vintages
$6.3
Our liability for obligations under representations and warranties given to
the GSEs considers the recent agreements and their impact on the repur-
chase rates on future repurchase claims we might receive on loans that have
defaulted or that we estimate will default. We believe that our remaining
exposure to representations and warranties for loans sold directly to the GSEs
has been accounted for as a result of these agreements and the associated
adjustments to our recorded liability for representations and warranties for
other loans sold directly to the GSEs and not covered by the agreements. We
believe our predictive repurchase models, utilizing our historical repurchase
experience with the GSEs while considering current developments, including
the recent agreements, projections of future defaults as well as certain
assumptions regarding economic conditions, home prices and other matters,
allows us to reasonably estimate the liability for obligations under represen-
tations and warranties on loans sold to the GSEs. However, future provisions
and possible loss or range of loss associated with representations and
warranties made to the GSEs may be impacted if actual results are different
from our assumptions regarding economic conditions, home prices and other
matters.
Transactions with Investors Other than Government-spon-
sored Entities
In prior years, legacy companies and certain subsidiaries have sold pools of
first-lien mortgage loans and home equity loans as private-label securitiza-
tions or in the form of whole loans. The loans sold include prime loans,
including loans with a loan balance in excess of the conforming loan limit, Alt-
A, pay-option, home equity and subprime loans. Many of the loans sold in the
form of whole loans were subsequently pooled with other mortgages into
private-label securitizations issued or sponsored by the third-party buyer of the
whole loans. In some of the private-label securitizations, monolines have
insured all or some of the issued bonds or certificates. In connection with
these securitizations and whole loan sales, we or our subsidiaries or our
legacy companies made various representations and warranties. Breaches of
these representations and warranties may result in the requirement to
repurchase mortgage loans from or to otherwise make whole or provide
other remedy to a whole-loan buyer or securitization trust.
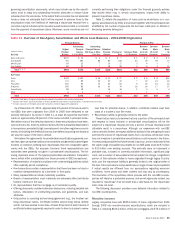
As detailed in Table 11, legacy companies and certain subsidiaries sold
loans originated from 2004 through 2008 with a principal balance of $963 bil-
lion to investors other than GSEs, of which approximately $478 billion in
principal has been paid and $216 billion have defaulted, or are severely
delinquent (i.e., 180 days or more past due) and are considered principal at-
risk at December 31, 2010. As of December 31, 2010, we had received
$13.7 billion of repurchase claims on these 2004-2008 loan vintages, of
which $6.0 billion have been resolved and $7.7 billion remain outstanding. Of
the $7.7 billion of repurchase claims that remain outstanding, we have
reviewed $4.1 billion that we have declined to repurchase. We have recog-
nized losses of $1.7 billion on the resolved repurchase claims, $631 million
of which relates to monolines and $1.1 billion of which relates to whole loan
and private-label investors, as described in more detail below.
As it relates to private investors, including those who have invested in
private-label securitizations, a contractual liability to repurchase mortgage loans
generally arises only if counterparties prove there is a breach of the represen-
tations and warranties that materially and adversely affects the interest of the
investor or all investors in a securitization trust, or that there is a breach of other
standards established by the terms of the related sale agreement. We believe
that the longer a loan performs, the less likely an underwriting representations
and warranties breach would have had a material impact on the loan’s perfor-
mance or that a breach even exists. Because the majority of the borrowers in
this population would have made a significant amount of payments if they are
not yet 180 days or more delinquent, we believe that the principal balance at the
greatest risk for repurchase requests in this population of private-label investors
is a combination of loans that have already defaulted and those that are
currently 180 days or more past due. Additionally, the obligation to repurchase
mortgage loans also requires that counterparties have the contractual right to
demand repurchase of the loans. Based on a recent court ruling that dismissed
a case against legacy Countrywide, we believe private-label securitization in-
vestors must generally aggregate 25 percent of the voting interests in each of
the tranches of a particular securitization to instruct the securitization trustee to
investigate potential repurchase claims. While a securitization trustee may elect
to investigate or demand repurchase of loans on its own, individual investors
typically have limited rights under the contracts to present repurchase claims
directly. Also, the motivation of some private-label securitization investors to
assert repurchase claims may be diminished by the fact that their investment is
not materially impacted by the losses due to the credit enhancement coverage
provided by cash flows from the tranches rated below AAA, for example.
Any amounts paid related to repurchase claims from a monoline are paid
to the securitization trust and are applied in accordance with the terms of the
58 Bank of America 2010