Bank of America 2010 Annual Report Download - page 243
Download and view the complete annual report
Please find page 243 of the 2010 Bank of America annual report below. You can navigate through the pages in the report by either clicking on the pages listed below, or by using the keyword search tool below to find specific information within the annual report.-
 1
1 -
2
-
3
-
4
-
5
-
6
-
7
-
8
-
9
-
10
-
11
-
12
-
13
-
14
-
15
-
16
-
17
-
18
-
19
-
20
-
21
-
22
-
23
-
24
-
25
-
26
-
27
-
28
-
29
-
30
-
31
-
32
-
33
-
34
-
35
-
36
-
37
-
38
-
39
-
40
-
41
-
42
-
43
-
44
-
45
-
46
-
47
-
48
-
49
-
50
-
51
-
52
-
53
-
54
-
55
-
56
-
57
-
58
-
59
-
60
-
61
-
62
-
63
-
64
-
65
-
66
-
67
-
68
-
69
-
70
-
71
-
72
-
73
-
74
-
75
-
76
-
77
-
78
-
79
-
80
-
81
-
82
-
83
-
84
-
85
-
86
-
87
-
88
-
89
-
90
-
91
-
92
-
93
-
94
-
95
-
96
-
97
-
98
-
99
-
100
-
101
-
102
-
103
-
104
-
105
-
106
-
107
-
108
-
109
-
110
-
111
-
112
-
113
-
114
-
115
-
116
-
117
-
118
-
119
-
120
-
121
-
122
-
123
-
124
-
125
-
126
-
127
-
128
-
129
-
130
-
131
-
132
-
133
-
134
-
135
-
136
-
137
-
138
-
139
-
140
-
141
-
142
-
143
-
144
-
145
-
146
-
147
-
148
-
149
-
150
-
151
-
152
-
153
-
154
-
155
-
156
-
157
-
158
-
159
-
160
-
161
-
162
-
163
-
164
-
165
-
166
-
167
-
168
-
169
-
170
-
171
-
172
-
173
-
174
-
175
-
176
-
177
-
178
-
179
-
180
-
181
-
182
-
183
-
184
-
185
-
186
-
187
-
188
-
189
-
190
-
191
-
192
-
193
-
194
-
195
-
196
-
197
-
198
-
199
-
200
-
201
-
202
-
203
-
204
-
205
-
206
-
207
-
208
-
209
-
210
-
211
-
212
-
213
-
214
-
215
-
216
-
217
-
218
-
219
-
220
-
221
-
222
-
223
-
224
-
225
-
226
-
227
-
228
-
229
-
230
-
231
-
232
-
 233
233 -
 234
234 -
 235
235 -
 236
236 -
 237
237 -
 238
238 -
 239
239 -
 240
240 -
 241
241 -
 242
242 -
 243
243 -
 244
244 -
 245
245 -
 246
246 -
 247
247 -
 248
248 -
 249
249 -
 250
250 -
 251
251 -
 252
252
 |
 |

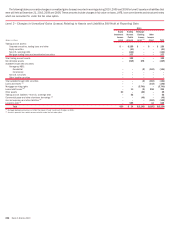
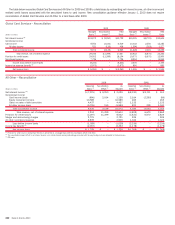
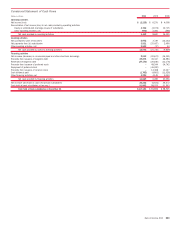
The tables below present a reconciliation of the six business segments’ total revenue, net of interest expense, on a FTE basis, and net income (loss) to the
Consolidated Statement of Income, and total assets to the Consolidated Balance Sheet. The adjustments presented in the tables below include consolidated
income, expense and asset amounts not specifically allocated to individual business segments.
(Dollars in millions)
2010 2009 2008
Segments’ total revenue, net of interest expense
(1)
$105,521
$119,740 $77,784
Adjustments:
ALM activities
1,924
(766) 2,390
Equity investment income
4,532
10,589 265
Liquidating businesses
1,336
2,268 1,819
FTE basis adjustment
(1,170)
(1,301) (1,194)
Managed securitization impact to total revenue, net of interest expense
n/a
(11,399) (6,670)
Other
(1,923)
512 (1,612)
Consolidated revenue, net of interest expense
$110,220
$119,643 $72,782
Segments’ net income (loss)
$(3,325)
$ 4,948 $ 5,066
Adjustments, net of taxes:
ALM activities
(1,966)
(6,597) (641)
Equity investment income
2,855
6,671 167
Liquidating businesses
318
477 378
Merger and restructuring charges
(1,146)
(1,714) (630)
Other
1,026
2,491 (332)
Consolidated net income (loss)
$(2,238)
$ 6,276 $ 4,008
(1)
FTE basis
n/a = not applicable
(Dollars in millions)
2010 2009
December 31
Segment total assets
$2,078,518
$2,086,654
Adjustments:
ALM activities, including securities portfolio
637,439
573,525
Equity investments
34,201
44,640
Liquidating businesses
10,928
34,761
Elimination of segment excess asset allocations to match liabilities
(645,846)
(585,994)
Elimination of managed securitized loans
(1)
n/a
(89,716)
Other
149,669
166,362
Consolidated total assets
$2,264,909
$2,230,232
(1)
Represents Global Card Services securitized loans. 2010 is presented in accordance with new consolidation guidance effective January 1, 2010. 2009 is presented on a managed basis.
n/a = not applicable
Bank of America 2010 241