Bank of America 2010 Annual Report Download - page 52
Download and view the complete annual report
Please find page 52 of the 2010 Bank of America annual report below. You can navigate through the pages in the report by either clicking on the pages listed below, or by using the keyword search tool below to find specific information within the annual report.-
 1
1 -
2
-
3
-
4
-
5
-
6
-
7
-
8
-
9
-
10
-
11
-
12
-
13
-
14
-
15
-
16
-
17
-
18
-
19
-
20
-
21
-
22
-
23
-
24
-
25
-
26
-
27
-
28
-
29
-
30
-
31
-
32
-
33
-
34
-
35
-
36
-
37
-
38
-
39
-
40
-
41
-
 42
42 -
 43
43 -
 44
44 -
 45
45 -
 46
46 -
 47
47 -
 48
48 -
 49
49 -
 50
50 -
 51
51 -
 52
52 -
 53
53 -
 54
54 -
 55
55 -
 56
56 -
 57
57 -
 58
58 -
 59
59 -
 60
60 -
 61
61 -
 62
62 -
63
-
64
-
65
-
66
-
67
-
68
-
69
-
70
-
71
-
72
-
73
-
74
-
75
-
76
-
77
-
78
-
79
-
80
-
81
-
82
-
83
-
84
-
85
-
86
-
87
-
88
-
89
-
90
-
91
-
92
-
93
-
94
-
95
-
96
-
97
-
98
-
99
-
100
-
101
-
102
-
103
-
104
-
105
-
106
-
107
-
108
-
109
-
110
-
111
-
112
-
113
-
114
-
115
-
116
-
117
-
118
-
119
-
120
-
121
-
122
-
123
-
124
-
125
-
126
-
127
-
128
-
129
-
130
-
131
-
132
-
133
-
134
-
135
-
136
-
137
-
138
-
139
-
140
-
141
-
142
-
143
-
144
-
145
-
146
-
147
-
148
-
149
-
150
-
151
-
152
-
153
-
154
-
155
-
156
-
157
-
158
-
159
-
160
-
161
-
162
-
163
-
164
-
165
-
166
-
167
-
168
-
169
-
170
-
171
-
172
-
173
-
174
-
175
-
176
-
177
-
178
-
179
-
180
-
181
-
182
-
183
-
184
-
185
-
186
-
187
-
188
-
189
-
190
-
191
-
192
-
193
-
194
-
195
-
196
-
197
-
198
-
199
-
200
-
201
-
202
-
203
-
204
-
205
-
206
-
207
-
208
-
209
-
210
-
211
-
212
-
213
-
214
-
215
-
216
-
217
-
218
-
219
-
220
-
221
-
222
-
223
-
224
-
225
-
226
-
227
-
228
-
229
-
230
-
231
-
232
-
233
-
234
-
235
-
236
-
237
-
238
-
239
-
240
-
241
-
242
-
243
-
244
-
245
-
246
-
247
-
248
-
249
-
250
-
251
-
252
 |
 |

from our trading activities and banking-based revenue which is related to our
credit and treasury service products.
Noninterest income decreased $2.6 billion due in part to the prior year
gain of $3.8 billion related to the contribution of the merchant processing
business to the joint venture. While overall sales and trading revenue were flat
year-over-year, the market in 2009 was more favorable but results were muted
by losses on legacy positions. Noninterest expense increased $2.1 billion
driven mainly by higher compensation costs from investments in infrastruc-
ture, professional fees and litigations expense.
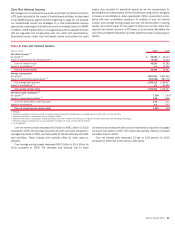
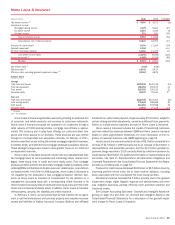
Components of Global Banking & Markets
Sales and Trading Revenue
Sales and trading revenue is segregated into fixed-income including invest-
ment and non-investment grade corporate debt obligations, commercial mort-
gage-backed securities (CMBS), RMBS and CDOs; currencies including inter-
est rate and foreign exchange contracts; commodities including primarily
futures, forwards, swaps and options; and equity income from equity-linked
derivatives and cash equity activity.
(Dollars in millions)
2010 2009
Sales and trading revenue
(1, 2)
Fixed income, currencies and commodities (FICC)
$13,158
$12,723
Equity income
4,145
4,902
Total sales and trading revenue
$17,303
$17,625
(1)
Includes $274 million and $353 million of net interest income on a FTE basis for 2010 and 2009.
(2)
Includes $2.4 billion and $2.6 billion of investment and brokerage services revenue for 2010 and 2009.
Sales and trading revenue decreased $322 million, or two percent, to
$17.3 billion in 2010 compared to 2009 due to increased investor risk
aversion and more favorable market conditions in the prior year. We recorded
net credit spread gains on derivative liabilities during 2010 of $242 million
compared to losses of $801 million in 2009.
FICC revenue increased $435 million to $13.2 billion due to significantly
lower market disruption charges, partially offset by lower revenue in our rates
and currencies, commodities and credit products due to diminished client
activity and European debt deterioration. Gains on legacy assets, primarily in
trading account profits (losses) and other income (loss), were $321 million for
2010 compared to write-downs of $3.8 billion in 2009. Legacy losses in the
prior year were primarily driven by our CMBS, CDO and leveraged finance
exposure.
Equity income was $4.1 billion in 2010 compared to $4.9 billion in 2009
driven by a decline in client flows and market conditions in the derivatives
business.
Investment Banking Income
Product specialists within GBAM underwrite and distribute debt and equity
issuances and certain other loan products, and provide advisory services. To
provide a complete discussion of our consolidated investment banking in-
come, the table below presents total investment banking income for the
Corporation of which, 93 percent in 2010 and 94 percent in 2009 is recorded
in GBAM with the remainder reported in GWIM and Global Commercial
Banking.
(Dollars in millions)
2010 2009
Investment banking income
Advisory
(1)
$1,019
$1,167
Debt issuance
3,267
3,124
Equity issuance
1,499
1,964
5,785
6,255
Offset for intercompany fees
(2)
(265)
(704)
Total investment banking income
$5,520
$5,551
(1)
Advisory includes fees on debt and equity advisory services and mergers and acquisitions.
(2)
Represents the offset to fees paid on the Corporation’s transactions.
Equity issuance fees decreased $465 million in 2010 primarily reflecting
lower levels of industry-wide activity and a decline in market-based revenue
pools. Debt issuance fees increased $143 million consistent with a five
percent increase in global fee pools in 2010. Strong performance within debt
issuance was mainly driven by higher revenues within leveraged finance.
Advisory fees decreased $148 million during 2010.
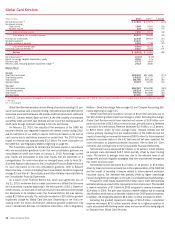
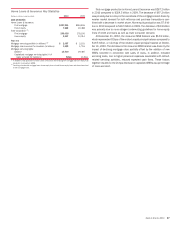
Global Corporate Banking
Client relationship teams along with product partners work with our customers
to provide them with a wide range of lending-related products and services,
integrated working capital management and treasury solutions through the
Corporation’s global network of offices. Global Corporate Banking lending
revenues of $3.4 billion for 2010 increased $567 million compared to 2009.
The increase in 2010 is primarily due to higher fees and the negative impact of
hedge results in 2009. Treasury services revenue of $2.8 billion for 2010
decreased $3.9 billion primarily due to a $3.8 billion pre-tax gain in the prior
year related to the contribution of the merchant processing business to a joint
venture. Equity investment income from the joint venture was $133 million for
2010. During 2010, we sold our trust administration business and in con-
nection with the sale provided certain commitments to the acquirer. See
Note 14 —Commitments and Contingencies to the Consolidated Financial
Statements for additional information.
50 Bank of America 2010