Bank of America 2010 Annual Report Download - page 199
Download and view the complete annual report
Please find page 199 of the 2010 Bank of America annual report below. You can navigate through the pages in the report by either clicking on the pages listed below, or by using the keyword search tool below to find specific information within the annual report.-
 1
1 -
2
-
3
-
4
-
5
-
6
-
7
-
8
-
9
-
10
-
11
-
12
-
13
-
14
-
15
-
16
-
17
-
18
-
19
-
20
-
21
-
22
-
23
-
24
-
25
-
26
-
27
-
28
-
29
-
30
-
31
-
32
-
33
-
34
-
35
-
36
-
37
-
38
-
39
-
40
-
41
-
42
-
43
-
44
-
45
-
46
-
47
-
48
-
49
-
50
-
51
-
52
-
53
-
54
-
55
-
56
-
57
-
58
-
59
-
60
-
61
-
62
-
63
-
64
-
65
-
66
-
67
-
68
-
69
-
70
-
71
-
72
-
73
-
74
-
75
-
76
-
77
-
78
-
79
-
80
-
81
-
82
-
83
-
84
-
85
-
86
-
87
-
88
-
89
-
90
-
91
-
92
-
93
-
94
-
95
-
96
-
97
-
98
-
99
-
100
-
101
-
102
-
103
-
104
-
105
-
106
-
107
-
108
-
109
-
110
-
111
-
112
-
113
-
114
-
115
-
116
-
117
-
118
-
119
-
120
-
121
-
122
-
123
-
124
-
125
-
126
-
127
-
128
-
129
-
130
-
131
-
132
-
133
-
134
-
135
-
136
-
137
-
138
-
139
-
140
-
141
-
142
-
143
-
144
-
145
-
146
-
147
-
148
-
149
-
150
-
151
-
152
-
153
-
154
-
155
-
156
-
157
-
158
-
159
-
160
-
161
-
162
-
163
-
164
-
165
-
166
-
167
-
168
-
169
-
170
-
171
-
172
-
173
-
174
-
175
-
176
-
177
-
178
-
179
-
180
-
181
-
182
-
183
-
184
-
185
-
186
-
187
-
188
-
 189
189 -
 190
190 -
 191
191 -
 192
192 -
 193
193 -
 194
194 -
 195
195 -
 196
196 -
 197
197 -
 198
198 -
 199
199 -
 200
200 -
 201
201 -
 202
202 -
 203
203 -
 204
204 -
 205
205 -
 206
206 -
 207
207 -
 208
208 -
 209
209 -
210
-
211
-
212
-
213
-
214
-
215
-
216
-
217
-
218
-
219
-
220
-
221
-
222
-
223
-
224
-
225
-
226
-
227
-
228
-
229
-
230
-
231
-
232
-
233
-
234
-
235
-
236
-
237
-
238
-
239
-
240
-
241
-
242
-
243
-
244
-
245
-
246
-
247
-
248
-
249
-
250
-
251
-
252
 |
 |

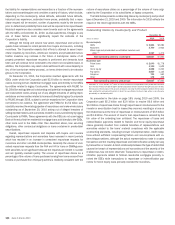
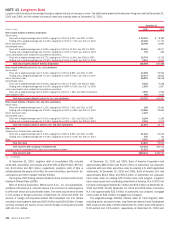
NOTE 14 Commitments and Contingencies
In the normal course of business, the Corporation enters into a number of off-
balance sheet commitments. These commitments expose the Corporation to
varying degrees of credit and market risk and are subject to the same credit
and market risk limitation reviews as those instruments recorded on the
Corporation’s Consolidated Balance Sheet.
Credit Extension Commitments
The Corporation enters into commitments to extend credit such as loan
commitments, SBLCs and commercial letters of credit to meet the financing
needs of its customers. The table below shows the notional amount of
unfunded legally binding lending commitments net of amounts distributed
(e.g., syndicated) to other financial institutions of $23.3 billion and $30.9 bil-
lion at December 31, 2010 and 2009. At December 31, 2010, the carrying
amount of these commitments, excluding commitments accounted for under
the fair value option, was $1.2 billion, including deferred revenue of $29 mil-
lion and a reserve for unfunded lending commitments of $1.2 billion. At
December 31, 2009, the comparable amounts were $1.5 billion, $34 million
and $1.5 billion, respectively. The carrying amount of these commitments is
classified in accrued expenses and other liabilities.
The table below also includes the notional amount of commitments of
$27.3 billion and $27.0 billion at December 31, 2010 and 2009, that are
accounted for under the fair value option. However, the table below excludes
fair value adjustments of $866 million and $950 million on these commit-
ments, which are classified in accrued expenses and other liabilities. For
information regarding the Corporation’s loan commitments accounted for
under the fair value option, see Note 23 – Fair Value Option.
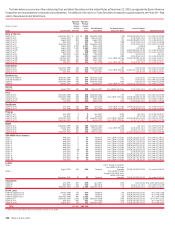
(Dollars in millions)
Expire in 1
Year or Less
Expire after 1
Year through
3 Years
Expire after 3
Years through
5 Years
Expire after 5
Years Total
December 31, 2010
Notional amount of credit extension commitments
Loan commitments
$152,926 $144,461 $43,465 $ 16,172 $ 357,024
Home equity lines of credit
1,722 4,290 18,207 55,886 80,105
Standby letters of credit and financial guarantees
(1)
35,275 18,940 4,144 5,897 64,256
Letters of credit
3,698 110 – 874 4,682
Legally binding commitments
193,621 167,801 65,816 78,829 506,067
Credit card lines
(2)
497,068 – – – 497,068
Total credit extension commitments $690,689 $167,801 $65,816 $ 78,829 $ 1,003,135
December 31, 2009
Notional amount of credit extension commitments
Loan commitments $149,248 $187,585 $30,897 $ 28,488 $ 396,218
Home equity lines of credit 1,810 3,272 10,667 76,923 92,672
Standby letters of credit and financial guarantees
(1)
29,794 21,285 4,923 13,740 69,742
Letters of credit 2,020 40 – 1,467 3,527
Legally binding commitments 182,872 212,182 46,487 120,618 562,159
Credit card lines
(2)
541,919 – – – 541,919
Total credit extension commitments
$724,791 $212,182 $46,487 $120,618 $1,104,078
(1)
The notional amounts of SBLCs and financial guarantees classified as investment grade and non-investment grade based on the credit quality of the underlying reference name within the instrument were $41.1 billion and $22.4 billion
at December 31, 2010 and $39.7 billion and $30.0 billion at December 31, 2009.
(2)
Includes business card unused lines of credit.
Legally binding commitments to extend credit generally have specified
rates and maturities. Certain of these commitments have adverse change
clauses that help to protect the Corporation against deterioration in the
borrower’s ability to pay.
Other Commitments
Global Principal Investments and Other Equity Investments
At December 31, 2010 and 2009, the Corporation had unfunded equity
investment commitments of approximately $1.5 billion and $2.8 billion. In
light of proposed Basel regulatory capital changes related to unfunded
commitments, the Corporation has actively reduced these commitments in
a series of transactions involving its private equity fund investments. For more
information on these Basel regulatory capital changes, see Note 18 – Regula-
tory Requirements and Restrictions. In 2010, the Corporation completed the
sale of its exposure to certain private equity funds. For more information on
these transactions, see Note 5 – Securities. These commitments generally
relate to the Corporation’s Global Principal Investments business which is
comprised of a diversified portfolio of investments in private equity, real
estate and other alternative investments. These investments are made either
directly in a company or held through a fund.
Bank of America 2010 197