Bank of America 2010 Annual Report Download - page 215
Download and view the complete annual report
Please find page 215 of the 2010 Bank of America annual report below. You can navigate through the pages in the report by either clicking on the pages listed below, or by using the keyword search tool below to find specific information within the annual report.-
 1
1 -
2
-
3
-
4
-
5
-
6
-
7
-
8
-
9
-
10
-
11
-
12
-
13
-
14
-
15
-
16
-
17
-
18
-
19
-
20
-
21
-
22
-
23
-
24
-
25
-
26
-
27
-
28
-
29
-
30
-
31
-
32
-
33
-
34
-
35
-
36
-
37
-
38
-
39
-
40
-
41
-
42
-
43
-
44
-
45
-
46
-
47
-
48
-
49
-
50
-
51
-
52
-
53
-
54
-
55
-
56
-
57
-
58
-
59
-
60
-
61
-
62
-
63
-
64
-
65
-
66
-
67
-
68
-
69
-
70
-
71
-
72
-
73
-
74
-
75
-
76
-
77
-
78
-
79
-
80
-
81
-
82
-
83
-
84
-
85
-
86
-
87
-
88
-
89
-
90
-
91
-
92
-
93
-
94
-
95
-
96
-
97
-
98
-
99
-
100
-
101
-
102
-
103
-
104
-
105
-
106
-
107
-
108
-
109
-
110
-
111
-
112
-
113
-
114
-
115
-
116
-
117
-
118
-
119
-
120
-
121
-
122
-
123
-
124
-
125
-
126
-
127
-
128
-
129
-
130
-
131
-
132
-
133
-
134
-
135
-
136
-
137
-
138
-
139
-
140
-
141
-
142
-
143
-
144
-
145
-
146
-
147
-
148
-
149
-
150
-
151
-
152
-
153
-
154
-
155
-
156
-
157
-
158
-
159
-
160
-
161
-
162
-
163
-
164
-
165
-
166
-
167
-
168
-
169
-
170
-
171
-
172
-
173
-
174
-
175
-
176
-
177
-
178
-
179
-
180
-
181
-
182
-
183
-
184
-
185
-
186
-
187
-
188
-
189
-
190
-
191
-
192
-
193
-
194
-
195
-
196
-
197
-
198
-
199
-
200
-
201
-
202
-
203
-
204
-
 205
205 -
 206
206 -
 207
207 -
 208
208 -
 209
209 -
 210
210 -
 211
211 -
 212
212 -
 213
213 -
 214
214 -
 215
215 -
 216
216 -
 217
217 -
 218
218 -
 219
219 -
 220
220 -
 221
221 -
 222
222 -
 223
223 -
 224
224 -
 225
225 -
226
-
227
-
228
-
229
-
230
-
231
-
232
-
233
-
234
-
235
-
236
-
237
-
238
-
239
-
240
-
241
-
242
-
243
-
244
-
245
-
246
-
247
-
248
-
249
-
250
-
251
-
252
 |
 |

allowance for loan and lease losses, a portion of net unrealized gains on AFS
marketable equity securities and other adjustments. Tier 3 capital includes
subordinated debt that is unsecured, fully paid, has an original maturity of at
least two years, is not redeemable before maturity without prior approval by
the Federal Reserve and includes a lock-in clause precluding payment of
either interest or principal if the payment would cause the issuing bank’s risk-
based capital ratio to fall or remain below the required minimum. Tier 3 capital
can only be used to satisfy the Corporation’s market risk capital requirement
and may not be used to support its credit risk requirement. At December 31,
2010 and 2009, the Corporation had no subordinated debt that qualified as
Tier 3 capital.
Certain corporate-sponsored trust companies which issue Trust Securities
are not consolidated. In accordance with Federal Reserve guidance, Trust
Securities continue to qualify as Tier 1 capital with revised quantitative limits
that will be effective on March 31, 2011. As a result, the Corporation includes
Trust Securities in Tier 1 capital. The Financial Reform Act includes a provision
under which the Corporation’s previously issued and outstanding Trust Secu-
rities in the aggregate amount of $19.9 billion (approximately 137 bps of
Tier 1 capital) at December 31, 2010, will no longer qualify as Tier 1 capital
effective January 1, 2013. This amount excludes $1.6 billion of hybrid
Trust Securities that are expected to be converted to preferred stock prior
to the date of implementation. The exclusion of Trust Securities from Tier 1
capital will be phased in incrementally over a three-year phase-in period. The
treatment of Trust Securities during the phase-in period remains unclear and
is subject to future rulemaking.
Current limits restrict core capital elements to 15 percent of total core
capital elements for internationally active bank holding companies. Interna-
tionally active bank holding companies are those that have significant activ-
ities in non-U.S. markets with consolidated assets greater than $250 billion
or on-balance sheet non-U.S. exposure greater than $10 billion. In addition,
the Federal Reserve revised the qualitative standards for capital instruments
included in regulatory capital. At December 31, 2010, the Corporation’s
restricted core capital elements comprised 11.4 percent of total core capital
elements. The Corporation is and expects to remain fully compliant with the
revised limits.
To meet minimum, adequately capitalized regulatory requirements, an
institution must maintain a Tier 1 capital ratio of four percent and a Total
capital ratio of eight percent. A “well-capitalized” institution must generally
maintain capital ratios 200 bps higher than the minimum guidelines. The risk-
based capital rules have been further supplemented by a Tier 1 leverage ratio,
defined as Tier 1 capital divided by quarterly average total assets, after
certain adjustments. “Well-capitalized” bank holding companies must have a
minimum Tier 1 leverage ratio of four percent. National banks must maintain a
Tier 1 leverage ratio of at least five percent to be classified as “well-capital-
ized.” At December 31, 2010, the Corporation’s Tier 1 capital, Total capital
and Tier 1 leverage ratios were 11.24 percent, 15.77 percent and 7.21 per-
cent, respectively. This classifies the Corporation as “well-capitalized” for
regulatory purposes, the highest classification.
Net unrealized gains or losses on AFS debt securities and marketable
equity securities, net unrealized gains and losses on derivatives, and em-
ployee benefit plan adjustments in shareholders’ equity are excluded from the
calculations of Tier 1 common capital as discussed below, Tier 1 capital and
leverage ratios. The Total capital ratio excludes all of the above with the
exception of up to 45 percent of the pre-tax net unrealized gains on AFS
marketable equity securities.
The Corporation calculates Tier 1 common capital as Tier 1 capital
including any CES less preferred stock, qualifying Trust Securities, hybrid
securities and qualifying noncontrolling interest in subsidiaries. CES was
included in Tier 1 common capital based upon applicable regulatory guidance
and the expectation at December 31, 2009 that the underlying Common
Equivalent Junior Preferred Stock, Series S would convert into common stock
following shareholder approval of additional authorized shares. Shareholders
approved the increase in the number of authorized shares of common stock
and the Common Equivalent Stock converted into common stock on Febru-
ary 24, 2010. Tier 1 common capital was $125.1 billion and $120.4 billion
and the Tier 1 common capital ratio was 8.60 percent and 7.81 percent at
December 31, 2010 and 2009.
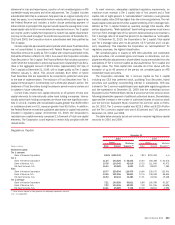
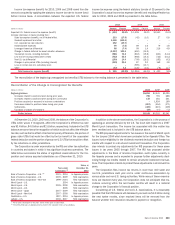
The table below presents actual and minimum required regulatory capital
amounts for 2010 and 2009.
Regulatory Capital
(Dollars in millions)
Ratio Amount
Minimum
Required
(1)
Ratio Amount
Minimum
Required
(1)
Actual Actual
2010 2009
December 31
Risk-based capital
Tier 1 common
Bank of America Corporation
8.60% $125,139 n/a
7.81% $120,394 n/a
Tier 1
Bank of America Corporation
11.24 163,626 $ 58,238
10.40 160,388 $ 61,676
Bank of America, N.A.
10.78 114,345 42,416
10.30 111,916 43,472
FIA Card Services, N.A.
15.30 25,589 6,691
15.21 28,831 7,584
Total
Bank of America Corporation
15.77 229,594 116,476
14.66 226,070 123,401
Bank of America, N.A.
14.26 151,255 84,831
13.76 149,528 86,944
FIA Card Services, N.A.
16.94 28,343 13,383
17.01 32,244 15,168
Tier 1 leverage
Bank of America Corporation
7.21 163,626 90,811
6.88 160,388 93,267
Bank of America, N.A.
7.83 114,345 58,391
7.38 111,916 60,626
FIA Card Services, N.A.
13.21 25,589 7,748
23.09 28,831 4,994
(1)
Dollar amount required to meet guidelines for adequately capitalized institutions.
n/a = not applicable
Bank of America 2010 213