Bank of America 2010 Annual Report Download - page 229
Download and view the complete annual report
Please find page 229 of the 2010 Bank of America annual report below. You can navigate through the pages in the report by either clicking on the pages listed below, or by using the keyword search tool below to find specific information within the annual report.-
 1
1 -
2
-
3
-
4
-
5
-
6
-
7
-
8
-
9
-
10
-
11
-
12
-
13
-
14
-
15
-
16
-
17
-
18
-
19
-
20
-
21
-
22
-
23
-
24
-
25
-
26
-
27
-
28
-
29
-
30
-
31
-
32
-
33
-
34
-
35
-
36
-
37
-
38
-
39
-
40
-
41
-
42
-
43
-
44
-
45
-
46
-
47
-
48
-
49
-
50
-
51
-
52
-
53
-
54
-
55
-
56
-
57
-
58
-
59
-
60
-
61
-
62
-
63
-
64
-
65
-
66
-
67
-
68
-
69
-
70
-
71
-
72
-
73
-
74
-
75
-
76
-
77
-
78
-
79
-
80
-
81
-
82
-
83
-
84
-
85
-
86
-
87
-
88
-
89
-
90
-
91
-
92
-
93
-
94
-
95
-
96
-
97
-
98
-
99
-
100
-
101
-
102
-
103
-
104
-
105
-
106
-
107
-
108
-
109
-
110
-
111
-
112
-
113
-
114
-
115
-
116
-
117
-
118
-
119
-
120
-
121
-
122
-
123
-
124
-
125
-
126
-
127
-
128
-
129
-
130
-
131
-
132
-
133
-
134
-
135
-
136
-
137
-
138
-
139
-
140
-
141
-
142
-
143
-
144
-
145
-
146
-
147
-
148
-
149
-
150
-
151
-
152
-
153
-
154
-
155
-
156
-
157
-
158
-
159
-
160
-
161
-
162
-
163
-
164
-
165
-
166
-
167
-
168
-
169
-
170
-
171
-
172
-
173
-
174
-
175
-
176
-
177
-
178
-
179
-
180
-
181
-
182
-
183
-
184
-
185
-
186
-
187
-
188
-
189
-
190
-
191
-
192
-
193
-
194
-
195
-
196
-
197
-
198
-
199
-
200
-
201
-
202
-
203
-
204
-
205
-
206
-
207
-
208
-
209
-
210
-
211
-
212
-
213
-
214
-
215
-
216
-
217
-
218
-
 219
219 -
 220
220 -
 221
221 -
 222
222 -
 223
223 -
 224
224 -
 225
225 -
 226
226 -
 227
227 -
 228
228 -
 229
229 -
 230
230 -
 231
231 -
 232
232 -
 233
233 -
 234
234 -
 235
235 -
 236
236 -
 237
237 -
 238
238 -
 239
239 -
240
-
241
-
242
-
243
-
244
-
245
-
246
-
247
-
248
-
249
-
250
-
251
-
252
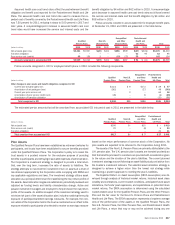
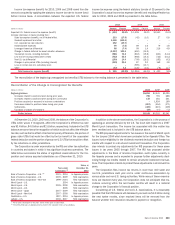
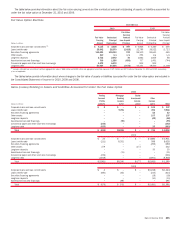
 |
 |

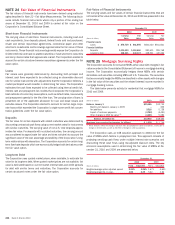
(Dollars in millions)
Level 1 Level 2 Level 3
Netting
Adjustments
(1)
Assets/Liabilities
at Fair Value
Fair Value Measurements
December 31, 2009
Assets
Federal funds sold and securities borrowed or purchased under
agreements to resell $ – $ 57,775 $ – $ – $ 57,775
Trading account assets:
U.S. government and agency securities 17,140 27,445 – – 44,585
Corporate securities, trading loans and other 4,772 41,157 11,080 – 57,009
Equity securities 25,274 7,204 1,084 – 33,562
Non-U.S. sovereign debt 19,827 7,173 1,143 – 28,143
Mortgage trading loans and asset-backed securities – 11,137 7,770 – 18,907
Total trading account assets 67,013 94,116 21,077 – 182,206
Derivative assets 3,326 1,467,855 23,048 (1,406,607) 87,622
Available-for-sale debt securities:
U.S. Treasury securities and agency securities 19,571 3,454 – – 23,025
Mortgage-backed securities:
Agency – 166,246 – – 166,246
Agency-collateralized mortgage obligations – 25,781 – – 25,781
Non-agency residential – 27,887 7,216 – 35,103
Non-agency commercial – 6,651 258 – 6,909
Non-U.S. securities 660 2,769 468 – 3,897
Corporate/Agency bonds – 5,265 927 – 6,192
Other taxable securities 676 14,721 9,854 – 25,251
Tax-exempt securities – 7,574 1,623 – 9,197
Total available-for-sale debt securities 20,907 260,348 20,346 – 301,601
Loans and leases – – 4,936 – 4,936
Mortgage servicing rights – – 19,465 – 19,465
Loans held-for-sale – 25,853 6,942 – 32,795
Other assets 35,411 12,677 7,821 – 55,909
Total assets
$126,657 $1,918,624 $103,635 $(1,406,607) $742,309
Liabilities
Interest-bearing deposits in U.S. offices $ – $ 1,663 $ – $ – $ 1,663
Federal funds purchased and securities loaned or sold under
agreements to repurchase – 37,325 – – 37,325
Trading account liabilities:
U.S. government and agency securities 22,339 4,180 – – 26,519
Equity securities 17,300 1,107 – – 18,407
Non-U.S. sovereign debt 12,028 483 386 – 12,897
Corporate securities and other 282 7,317 10 – 7,609
Total trading account liabilities 51,949 13,087 396 – 65,432
Derivative liabilities 2,925 1,443,494 15,185 (1,410,943) 50,661
Commercial paper and other short-term borrowings – 813 707 – 1,520
Accrued expenses and other liabilities 16,797 620 891 – 18,308
Long-term debt – 40,791 4,660 – 45,451
Total liabilities
$ 71,671 $1,537,793 $ 21,839 $(1,410,943) $220,360
(1)
Amounts represent the impact of legally enforceable master netting agreements and also cash collateral held or placed with the same counterparties.
Bank of America 2010 227