Bank of America 2010 Annual Report Download - page 145
Download and view the complete annual report
Please find page 145 of the 2010 Bank of America annual report below. You can navigate through the pages in the report by either clicking on the pages listed below, or by using the keyword search tool below to find specific information within the annual report.-
 1
1 -
2
-
3
-
4
-
5
-
6
-
7
-
8
-
9
-
10
-
11
-
12
-
13
-
14
-
15
-
16
-
17
-
18
-
19
-
20
-
21
-
22
-
23
-
24
-
25
-
26
-
27
-
28
-
29
-
30
-
31
-
32
-
33
-
34
-
35
-
36
-
37
-
38
-
39
-
40
-
41
-
42
-
43
-
44
-
45
-
46
-
47
-
48
-
49
-
50
-
51
-
52
-
53
-
54
-
55
-
56
-
57
-
58
-
59
-
60
-
61
-
62
-
63
-
64
-
65
-
66
-
67
-
68
-
69
-
70
-
71
-
72
-
73
-
74
-
75
-
76
-
77
-
78
-
79
-
80
-
81
-
82
-
83
-
84
-
85
-
86
-
87
-
88
-
89
-
90
-
91
-
92
-
93
-
94
-
95
-
96
-
97
-
98
-
99
-
100
-
101
-
102
-
103
-
104
-
105
-
106
-
107
-
108
-
109
-
110
-
111
-
112
-
113
-
114
-
115
-
116
-
117
-
118
-
119
-
120
-
121
-
122
-
123
-
124
-
125
-
126
-
127
-
128
-
129
-
130
-
131
-
132
-
133
-
134
-
 135
135 -
 136
136 -
 137
137 -
 138
138 -
 139
139 -
 140
140 -
 141
141 -
 142
142 -
 143
143 -
 144
144 -
 145
145 -
 146
146 -
 147
147 -
 148
148 -
 149
149 -
 150
150 -
 151
151 -
 152
152 -
 153
153 -
 154
154 -
 155
155 -
156
-
157
-
158
-
159
-
160
-
161
-
162
-
163
-
164
-
165
-
166
-
167
-
168
-
169
-
170
-
171
-
172
-
173
-
174
-
175
-
176
-
177
-
178
-
179
-
180
-
181
-
182
-
183
-
184
-
185
-
186
-
187
-
188
-
189
-
190
-
191
-
192
-
193
-
194
-
195
-
196
-
197
-
198
-
199
-
200
-
201
-
202
-
203
-
204
-
205
-
206
-
207
-
208
-
209
-
210
-
211
-
212
-
213
-
214
-
215
-
216
-
217
-
218
-
219
-
220
-
221
-
222
-
223
-
224
-
225
-
226
-
227
-
228
-
229
-
230
-
231
-
232
-
233
-
234
-
235
-
236
-
237
-
238
-
239
-
240
-
241
-
242
-
243
-
244
-
245
-
246
-
247
-
248
-
249
-
250
-
251
-
252
 |
 |

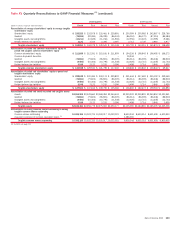
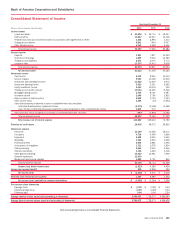
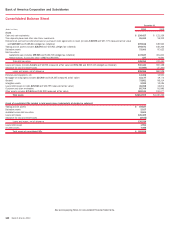
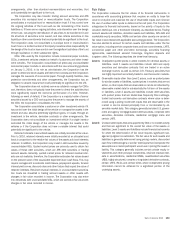
Bank of America Corporation and Subsidiaries
Consolidated Balance Sheet (continued)
(Dollars in millions)
2010 2009
December 31
Liabilities
Deposits in U.S. offices:
Noninterest-bearing
$ 285,200
$269,615
Interest-bearing (includes
$2,732 and $1,663 measured at fair value)
645,713
640,789
Deposits in non-U.S. offices:
Noninterest-bearing
6,101
5,489
Interest-bearing
73,416
75,718
Total deposits
1,010,430
991,611
Federal funds purchased and securities loaned or sold under agreements to repurchase (includes
$37,424 and $37,325 measured
at fair value)
245,359
255,185
Trading account liabilities
71,985
65,432
Derivative liabilities
55,914
50,661
Commercial paper and other short-term borrowings (includes
$7,178 and $1,520 measured at fair value)
59,962
69,524
Accrued expenses and other liabilities (includes
$33,229 and $18,308 measured at fair value and $1,188 and $1,487 of reserve for
unfunded lending commitments)
144,580
127,854
Long-term debt (includes
$50,984 and $45,451 measured at fair value)
448,431
438,521
Total liabilities
2,036,661
1,998,788
Commitments and contingencies (Note 8 – Securitizations and Other Variable Interest Entities, Note 9 – Representations and Warranties
Obligations and Corporate Guarantees and Note 14 – Commitments and Contingencies)
Shareholders’ equity
Preferred stock, $0.01 par value; authorized –
100,000,000 shares; issued and outstanding – 3,943,660 and 5,246,660 shares
16,562
37,208
Common stock and additional paid-in capital, $0.01 par value; authorized –
12,800,000,000 and 10,000,000,000 shares; issued and
outstanding – 10,085,154,806 and 8,650,243,926 shares
150,905
128,734
Retained earnings
60,849
71,233
Accumulated other comprehensive income (loss)
(66)
(5,619)
Other
(2)
(112)
Total shareholders’ equity
228,248
231,444
Total liabilities and shareholders’ equity
$2,264,909
$2,230,232
Liabilities of consolidated VIEs included in total liabilities above
Commercial paper and other short-term borrowings (includes
$706 of non-recourse liabilities)
$6,742
Long-term debt (includes
$66,309 of non-recourse debt)
71,013
All other liabilities (includes
$382 of non-recourse liabilities)
9,141
Total liabilities of consolidated VIEs
$86,896
See accompanying Notes to Consolidated Financial Statements.
Bank of America 2010 143