Bank of America 2010 Annual Report Download - page 109
Download and view the complete annual report
Please find page 109 of the 2010 Bank of America annual report below. You can navigate through the pages in the report by either clicking on the pages listed below, or by using the keyword search tool below to find specific information within the annual report.-
 1
1 -
2
-
3
-
4
-
5
-
6
-
7
-
8
-
9
-
10
-
11
-
12
-
13
-
14
-
15
-
16
-
17
-
18
-
19
-
20
-
21
-
22
-
23
-
24
-
25
-
26
-
27
-
28
-
29
-
30
-
31
-
32
-
33
-
34
-
35
-
36
-
37
-
38
-
39
-
40
-
41
-
42
-
43
-
44
-
45
-
46
-
47
-
48
-
49
-
50
-
51
-
52
-
53
-
54
-
55
-
56
-
57
-
58
-
59
-
60
-
61
-
62
-
63
-
64
-
65
-
66
-
67
-
68
-
69
-
70
-
71
-
72
-
73
-
74
-
75
-
76
-
77
-
78
-
79
-
80
-
81
-
82
-
83
-
84
-
85
-
86
-
87
-
88
-
89
-
90
-
91
-
92
-
93
-
94
-
95
-
96
-
97
-
98
-
 99
99 -
 100
100 -
 101
101 -
 102
102 -
 103
103 -
 104
104 -
 105
105 -
 106
106 -
 107
107 -
 108
108 -
 109
109 -
 110
110 -
 111
111 -
 112
112 -
 113
113 -
 114
114 -
 115
115 -
 116
116 -
 117
117 -
 118
118 -
 119
119 -
120
-
121
-
122
-
123
-
124
-
125
-
126
-
127
-
128
-
129
-
130
-
131
-
132
-
133
-
134
-
135
-
136
-
137
-
138
-
139
-
140
-
141
-
142
-
143
-
144
-
145
-
146
-
147
-
148
-
149
-
150
-
151
-
152
-
153
-
154
-
155
-
156
-
157
-
158
-
159
-
160
-
161
-
162
-
163
-
164
-
165
-
166
-
167
-
168
-
169
-
170
-
171
-
172
-
173
-
174
-
175
-
176
-
177
-
178
-
179
-
180
-
181
-
182
-
183
-
184
-
185
-
186
-
187
-
188
-
189
-
190
-
191
-
192
-
193
-
194
-
195
-
196
-
197
-
198
-
199
-
200
-
201
-
202
-
203
-
204
-
205
-
206
-
207
-
208
-
209
-
210
-
211
-
212
-
213
-
214
-
215
-
216
-
217
-
218
-
219
-
220
-
221
-
222
-
223
-
224
-
225
-
226
-
227
-
228
-
229
-
230
-
231
-
232
-
233
-
234
-
235
-
236
-
237
-
238
-
239
-
240
-
241
-
242
-
243
-
244
-
245
-
246
-
247
-
248
-
249
-
250
-
251
-
252
 |
 |

Interest Rate Risk Management for Nontrading
Activities
Interest rate risk represents the most significant market risk exposure to our
nontrading exposures. Our overall goal is to manage interest rate risk so that
movements in interest rates do not adversely affect core net interest income.
Interest rate risk is measured as the potential volatility in our core net interest
income caused by changes in market interest rates. Client-facing activities,
primarily lending and deposit-taking, create interest rate sensitive positions
on our balance sheet. Interest rate risk from these activities, as well as the
impact of changing market conditions, is managed through our ALM activities.
Simulations are used to estimate the impact on core net interest income
of numerous interest rate scenarios, balance sheet trends and strategies.
These simulations evaluate how changes in short-term financial instruments,
debt securities, loans, deposits, borrowings and derivative instruments im-
pact core net interest income. In addition, these simulations incorporate
assumptions about balance sheet dynamics such as loan and deposit growth
and pricing, changes in funding mix, and asset and liability repricing and
maturity characteristics. These simulations do not include the impact of
hedge ineffectiveness.
Management analyzes core net interest income forecasts utilizing differ-
ent rate scenarios with the baseline utilizing market-based forward interest
rates. Management frequently updates the core net interest income forecast
for changing assumptions and differing outlooks based on economic trends
and market conditions. Thus, we continually monitor our balance sheet
position in an effort to maintain an acceptable level of exposure to interest
rate changes.
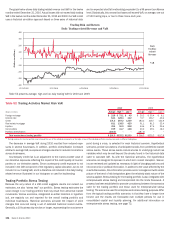
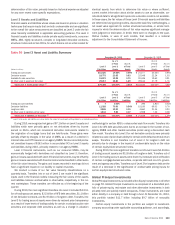
We prepare forward-looking forecasts of core net interest income. The
baseline forecast takes into consideration expected future business growth,
ALM positioning and the direction of interest rate movements as implied by
the market-based forward curve. We then measure and evaluate the impact
that alternative interest rate scenarios have on the static baseline forecast in
order to assess interest rate sensitivity under varied conditions. The spot and
12-month forward monthly rates used in our respective baseline forecast at
December 31, 2010 and 2009 are presented in the table below.
Table 53 Forward Rates
Federal
Funds
Three-Month
LIBOR
10-Year
Swap
Federal
Funds
Three-Month
LIBOR
10-Year
Swap
2010 2009
December 31
Spot rates
0.25% 0.30% 3.39%
0.25% 0.25% 3.97%
12-month forward rates
0.25 0.72 3.86
1.14 1.53 4.47
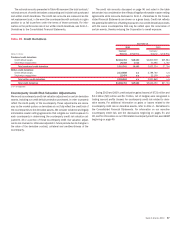
Table 54 shows the pre-tax dollar impact to forecasted core net interest
income over the next twelve months from December 31, 2010 and 2009,
resulting from a 100 bps gradual parallel increase, a 100 bps gradual parallel
decrease, a 100 bps gradual curve flattening (increase in short-term rates or
decrease in long-term rates) and a 100 bps gradual curve steepening (de-
crease in short-term rates or increase in long-term rates) from the forward
market curve. For further discussion of core net interest income, see
page 41.
Table 54 Estimated Core Net Interest Income
(1)
Curve Change Short Rate (bps) Long Rate (bps) 2010 2009
(Dollars in millions)
December 31
+100 bps Parallel shift +100 +100
$601
$598
-100 bps Parallel shift –100 –100
(834)
(1,084)
Flatteners
Short end +100 –
136
127
Long end – –100
(637)
(616)
Steepeners
Short end –100 –
(170)
(444)
Long end –+100
493
476
(1)
Prior periods are reported on a managed basis.
The sensitivity analysis above assumes that we take no action in response
to these rate shifts over the indicated periods. At December 31, 2010, the
exposure as reported reflects impacts that may be realized in net interest
income. At December 31, 2009, the estimated exposure as reported reflects
impacts that would have been realized primarily in net interest income and
card income.
Our core net interest income was asset sensitive to a parallel move in
interest rates at both December 31, 2010 and 2009. The change in the
interest rate risk position relative to December 31, 2009 is primarily due to
lower short-term interest rates. As part of our ALM activities, we use secu-
rities, residential mortgages, and interest rate and foreign exchange deriva-
tives in managing interest rate sensitivity.
Securities
The securities portfolio is an integral part of our ALM position and is primarily
comprised of debt securities including MBS and to a lesser extent U.S. Trea-
sury, corporate, municipal and other debt securities. At December 31, 2010
and 2009, AFS debt securities were $337.6 billion and $301.6 billion. During
2010 and 2009, we purchased AFS debt securities of $199.2 billion and
$185.1 billion, sold $97.5 billion and $159.4 billion, and had maturities and
received paydowns of $70.9 billion and $59.9 billion. We realized $2.5 billion
and $4.7 billion in net gains on sales of debt securities during 2010 and
2009. In addition, we securitized $2.4 billion and $14.0 billion of residential
mortgage loans into MBS during 2010 and 2009, which we retained.
Bank of America 2010 107