Bank of America 2010 Annual Report Download - page 219
Download and view the complete annual report
Please find page 219 of the 2010 Bank of America annual report below. You can navigate through the pages in the report by either clicking on the pages listed below, or by using the keyword search tool below to find specific information within the annual report.-
 1
1 -
2
-
3
-
4
-
5
-
6
-
7
-
8
-
9
-
10
-
11
-
12
-
13
-
14
-
15
-
16
-
17
-
18
-
19
-
20
-
21
-
22
-
23
-
24
-
25
-
26
-
27
-
28
-
29
-
30
-
31
-
32
-
33
-
34
-
35
-
36
-
37
-
38
-
39
-
40
-
41
-
42
-
43
-
44
-
45
-
46
-
47
-
48
-
49
-
50
-
51
-
52
-
53
-
54
-
55
-
56
-
57
-
58
-
59
-
60
-
61
-
62
-
63
-
64
-
65
-
66
-
67
-
68
-
69
-
70
-
71
-
72
-
73
-
74
-
75
-
76
-
77
-
78
-
79
-
80
-
81
-
82
-
83
-
84
-
85
-
86
-
87
-
88
-
89
-
90
-
91
-
92
-
93
-
94
-
95
-
96
-
97
-
98
-
99
-
100
-
101
-
102
-
103
-
104
-
105
-
106
-
107
-
108
-
109
-
110
-
111
-
112
-
113
-
114
-
115
-
116
-
117
-
118
-
119
-
120
-
121
-
122
-
123
-
124
-
125
-
126
-
127
-
128
-
129
-
130
-
131
-
132
-
133
-
134
-
135
-
136
-
137
-
138
-
139
-
140
-
141
-
142
-
143
-
144
-
145
-
146
-
147
-
148
-
149
-
150
-
151
-
152
-
153
-
154
-
155
-
156
-
157
-
158
-
159
-
160
-
161
-
162
-
163
-
164
-
165
-
166
-
167
-
168
-
169
-
170
-
171
-
172
-
173
-
174
-
175
-
176
-
177
-
178
-
179
-
180
-
181
-
182
-
183
-
184
-
185
-
186
-
187
-
188
-
189
-
190
-
191
-
192
-
193
-
194
-
195
-
196
-
197
-
198
-
199
-
200
-
201
-
202
-
203
-
204
-
205
-
206
-
207
-
208
-
 209
209 -
 210
210 -
 211
211 -
 212
212 -
 213
213 -
 214
214 -
 215
215 -
 216
216 -
 217
217 -
 218
218 -
 219
219 -
 220
220 -
 221
221 -
 222
222 -
 223
223 -
 224
224 -
 225
225 -
 226
226 -
 227
227 -
 228
228 -
 229
229 -
230
-
231
-
232
-
233
-
234
-
235
-
236
-
237
-
238
-
239
-
240
-
241
-
242
-
243
-
244
-
245
-
246
-
247
-
248
-
249
-
250
-
251
-
252
 |
 |

Assumed health care cost trend rates affect the postretirement benefit
obligation and benefit cost reported for the Postretirement Health and Life
Plans. The assumed health care cost trend rate used to measure the ex-
pected cost of benefits covered by the Postretirement Health and Life Plans
was 7.50 percent for 2011, reducing in steps to 5.00 percent in 2017 and
later years. A one-percentage-point increase in assumed health care cost
trend rates would have increased the service and interest costs and the
benefit obligation by $4 million and $62 million in 2010. A one-percentage-
point decrease in assumed health care cost trend rates would have lowered
the service and interest costs and the benefit obligation by $4 million and
$58 million in 2010.
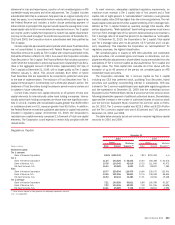
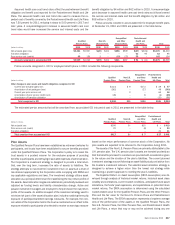
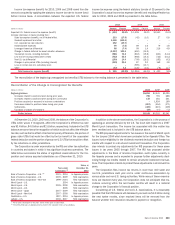
Pre-tax amounts included in accumulated OCI for employee benefit plans
at December 31, 2010 and 2009 are presented in the table below.
(Dollars in millions)
2010 2009 2010 2009 2010 2009 2010 2009 2010 2009
Qualified
Pension Plans
Postretirement
Health and
Life Plans
Non-U.S.
Pension Plans
Nonqualified
and Other
Pension Plans Total
Net actuarial (gain) loss
$5,461
$5,937
$(20)
$(30)
$656
$509
$(27)
$(106)
$6,070
$6,310
Transition obligation
–
–
–
–
–
–
63
95
63
95
Prior service cost (credits)
98
126
1
–
(15)
(22)
58
–
142
104
Amounts recognized in accumulated OCI
$5,559
$6,063
$(19)
$(30)
$641
$487
$94
$(11)
$6,275
$6,509
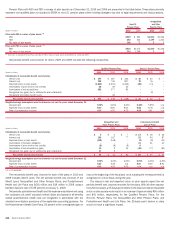
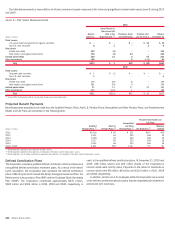
Pre-tax amounts recognized in OCI for employee benefit plans in 2010 included the following components.
(Dollars in millions)
Qualified
Pension Plans
Non-U.S.
Pension Plans
Nonqualified
and Other
Pension Plans
Postretirement
Health and
Life Plans Total
Other changes in plan assets and benefit obligations recognized in OCI
Current year actuarial (gain) loss $(114) $ 9 $173 $ 29
$97
Amortization of actuarial gain (loss) (362) – (27) 49
(340)
Current year prior service cost –2 –64
66
Amortization of prior service credit (cost) (28) – 8 (6)
(26)
Amortization of transition obligation – – – (31)
(31)
Total recognized in OCI $(504) $11 $154 $105 $(234)
The estimated pre-tax amounts that will be amortized from accumulated OCI into period cost in 2011 are presented in the table below.
(Dollars in millions)
Qualified
Pension Plans
Non-U.S.
Pension Plans
Nonqualified
and Other
Pension Plans
Postretirement
Health and
Life Plans Total
Net actuarial loss $395 $– $15 $ –
$410
Prior service cost (credit) 22 – (8) 6
20
Transition obligation –––31
31
Total amortized from accumulated OCI $417 $– $ 7 $ 37 $ 461
Plan Assets
The Qualified Pension Plans have been established as retirement vehicles for
participants, and trusts have been established to secure benefits promised
under the Qualified Pension Plans. The Corporation’s policy is to invest the
trust assets in a prudent manner for the exclusive purpose of providing
benefits to participants and defraying reasonable expenses of administration.
The Corporation’s investment strategy is designed to provide a total return
that, over the long term, increases the ratio of assets to liabilities. The
strategy attempts to maximize the investment return on assets at a level of
risk deemed appropriate by the Corporation while complying with ERISA and
any applicable regulations and laws. The investment strategy utilizes asset
allocation as a principal determinant for establishing the risk/return profile of
the assets. Asset allocation ranges are established, periodically reviewed and
adjusted as funding levels and liability characteristics change. Active and
passive investment managers are employed to help enhance the risk/return
profile of the assets. An additional aspect of the investment strategy used to
minimize risk (part of the asset allocation plan) includes matching the equity
exposure of participant-selected earnings measures. For example, the com-
mon stock of the Corporation held in the trust is maintained as an offset to the
exposure related to participants who elected to receive an earnings measure
based on the return performance of common stock of the Corporation. No
plan assets are expected to be returned to the Corporation during 2011.
The assets of the Non-U.S. Pension Plans are primarily attributable to the
U.K. pension plan. The U.K. pension plan’s assets are invested prudently so
that the benefits promised to members are provided with consideration given
to the nature and the duration of the plan’s liabilities. The current planned
investment strategy was set following an asset-liability study and advice from
the trustee’s investment advisors. The selected asset allocation strategy is
designed to achieve a higher return than the lowest risk strategy while
maintaining a prudent approach to meeting the plan’s liabilities.
The Expected Return on Asset assumption (EROA assumption) was de-
veloped through analysis of historical market returns, historical asset class
volatility and correlations, current market conditions, anticipated future asset
allocations, the funds’ past experience, and expectations on potential future
market returns. The EROA assumption is determined using the calculated
market-related value for the Qualified Pension Plans and the Other Pension
Plan and the fair value for the Non-U.S. Pension Plans and Postretirement
Health and Life Plans. The EROA assumption represents a long-term average
view of the performance of the assets in the Qualified Pension Plans, the
Non-U.S. Pension Plans, the Other Pension Plan, and Postretirement Health
and Life Plans, a return that may or may not be achieved during any one
Bank of America 2010 217