Bank of America 2010 Annual Report Download - page 82
Download and view the complete annual report
Please find page 82 of the 2010 Bank of America annual report below. You can navigate through the pages in the report by either clicking on the pages listed below, or by using the keyword search tool below to find specific information within the annual report.-
 1
1 -
2
-
3
-
4
-
5
-
6
-
7
-
8
-
9
-
10
-
11
-
12
-
13
-
14
-
15
-
16
-
17
-
18
-
19
-
20
-
21
-
22
-
23
-
24
-
25
-
26
-
27
-
28
-
29
-
30
-
31
-
32
-
33
-
34
-
35
-
36
-
37
-
38
-
39
-
40
-
41
-
42
-
43
-
44
-
45
-
46
-
47
-
48
-
49
-
50
-
51
-
52
-
53
-
54
-
55
-
56
-
57
-
58
-
59
-
60
-
61
-
62
-
63
-
64
-
65
-
66
-
67
-
68
-
69
-
70
-
71
-
 72
72 -
 73
73 -
 74
74 -
 75
75 -
 76
76 -
 77
77 -
 78
78 -
 79
79 -
 80
80 -
 81
81 -
 82
82 -
 83
83 -
 84
84 -
 85
85 -
 86
86 -
 87
87 -
 88
88 -
 89
89 -
 90
90 -
 91
91 -
 92
92 -
93
-
94
-
95
-
96
-
97
-
98
-
99
-
100
-
101
-
102
-
103
-
104
-
105
-
106
-
107
-
108
-
109
-
110
-
111
-
112
-
113
-
114
-
115
-
116
-
117
-
118
-
119
-
120
-
121
-
122
-
123
-
124
-
125
-
126
-
127
-
128
-
129
-
130
-
131
-
132
-
133
-
134
-
135
-
136
-
137
-
138
-
139
-
140
-
141
-
142
-
143
-
144
-
145
-
146
-
147
-
148
-
149
-
150
-
151
-
152
-
153
-
154
-
155
-
156
-
157
-
158
-
159
-
160
-
161
-
162
-
163
-
164
-
165
-
166
-
167
-
168
-
169
-
170
-
171
-
172
-
173
-
174
-
175
-
176
-
177
-
178
-
179
-
180
-
181
-
182
-
183
-
184
-
185
-
186
-
187
-
188
-
189
-
190
-
191
-
192
-
193
-
194
-
195
-
196
-
197
-
198
-
199
-
200
-
201
-
202
-
203
-
204
-
205
-
206
-
207
-
208
-
209
-
210
-
211
-
212
-
213
-
214
-
215
-
216
-
217
-
218
-
219
-
220
-
221
-
222
-
223
-
224
-
225
-
226
-
227
-
228
-
229
-
230
-
231
-
232
-
233
-
234
-
235
-
236
-
237
-
238
-
239
-
240
-
241
-
242
-
243
-
244
-
245
-
246
-
247
-
248
-
249
-
250
-
251
-
252
 |
 |

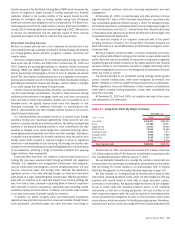
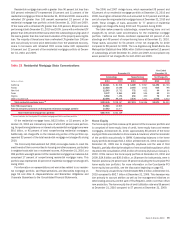
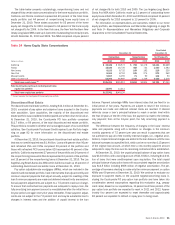
The table below presents certain home equity key credit statistics on both a reported basis as well as excluding the Countrywide PCI loan portfolio. We
believe the presentation of information adjusted to exclude the impacts of the Countrywide PCI loan portfolio is more representative of the credit risk in this
por tfolio.
Table 23 Home Equity – Key Credit Statistics
(Dollars in millions)
2010 2009 2010 2009
Reported Basis
Excluding Countrywide
Purchased Credit-
impaired Loans
December 31
Outstandings
$137,981
$149,126
$125,391
$135,912
Nonperforming loans
2,694
3,804
2,694
3,804
Percent of portfolio with refreshed CLTVs greater than 90 but less than 100
11%
12%
11%
12%
Percent of portfolio with refreshed CLTVs greater than 100
34
35
30
31
Percent of portfolio with refreshed FICOs below 620
14
13
12
13
Percent of portfolio in the 2006 and 2007 vintages
50
52
47
49
Net charge-off ratio
4.65
4.56
5.10
5.00
The following discussion presents the home equity portfolio excluding the
Countrywide PCI loan portfolio.
Nonperforming home equity loans decreased $1.1 billion to $2.7 billion
compared to December 31, 2009 driven primarily by charge-offs, including
those recorded in connection with regulatory guidance clarifying the timing of
charge-offs on collateral dependent modified loans, and nonperforming loans
returning to performing status which together outpaced delinquency inflows
and the impact of the adoption of new consolidation guidance. At Decem-
ber 31, 2010, $916 million, or 34 percent, of the nonperforming home equity
loans were 180 days or more past due and had been written down to their fair
values. Net charge-offs decreased $269 million to $6.8 billion, or 5.10 per-
cent, of total average home equity loans for 2010 compared to $7.1 billion, or
5.00 percent, for 2009. The decrease was primarily driven by favorable
portfolio trends due in part to improvement in the U.S. economy. This was
partially offset by $822 million of net charge-offs related to the implemen-
tation of regulatory guidance on collateral dependent modified loans and
$463 million of net charge-offs related to home equity loans that were
consolidated on January 1, 2010 under new consolidation guidance. Net
charge-off ratios were further impacted by lower loan balances primarily as a
result of charge-offs, paydowns and the sale of First Republic.
There are certain risk characteristics of the home equity portfolio which
have contributed to higher losses including loans with a high refreshed
combined loan-to-value (CLTV), loans originated at the peak of home prices
in 2006 and 2007 and loans in geographic areas that have experienced the
most significant declines in home prices. Home price declines coupled with
the fact that most home equity loans are secured by second-lien positions
have significantly reduced and, in some cases, eliminated all collateral value
after consideration of the first-lien position. Although the following disclosures
address each of these risk characteristics separately, there is significant
overlap in loans with these characteristics, which has contributed to a
disproportionate share of losses in the portfolio. Home equity loans with
all of these higher risk characteristics comprised 10 percent and 11 percent
of the total home equity portfolio at December 31, 2010 and 2009, but have
accounted for 29 percent of the home equity net charge-offs in 2010 com-
pared to 38 percent in 2009.
Home equity loans with greater than 90 percent but less than 100 percent
refreshed CLTVs comprised 11 percent and 12 percent of the home equity
portfolio at December 31, 2010 and 2009. Loans with refreshed CLTVs
greater than 100 percent comprised 30 percent and 31 percent of the home
equity portfolio at December 31, 2010 and 2009. Of those loans with a
refreshed CLTV greater than 100 percent, 97 percent were performing at
December 31, 2010 while 95 percent were performing at December 31,
2009. Home equity loans and lines of credit with a refreshed CLTV greater
than 100 percent reflect loans where the carrying value and available line of
credit of the combined loans are equal to or greater than the most recent
valuation of the property securing the loan. Depending on the LTV of the first
lien, there may be collateral in excess of the first lien that is available to
reduce the severity of loss on the second lien. The majority of these high
refreshed CLTV ratios are due to home price declines. In addition, loans to
borrowers with a refreshed FICO score below 620 represented 12 percent and
13 percent of the home equity loans at December 31, 2010 and 2009. Of the
total home equity portfolio, 75 percent and 72 percent at December 31, 2010
and 2009 were interest-only loans.
The 2006 and 2007 vintage loans, which represent 47 percent and
49 percent of our home equity portfolio at December 31, 2010 and 2009,
have higher refreshed CLTVs and accounted for 57 percent of nonperforming
home equity loans at December 31, 2010 compared to 62 percent at
December 31, 2009. These vintages of loans accounted for 66 percent of
net charge-offs in 2010 compared to 72 percent in 2009.
80 Bank of America 2010