Bank of America 2010 Annual Report Download - page 80
Download and view the complete annual report
Please find page 80 of the 2010 Bank of America annual report below. You can navigate through the pages in the report by either clicking on the pages listed below, or by using the keyword search tool below to find specific information within the annual report.-
 1
1 -
2
-
3
-
4
-
5
-
6
-
7
-
8
-
9
-
10
-
11
-
12
-
13
-
14
-
15
-
16
-
17
-
18
-
19
-
20
-
21
-
22
-
23
-
24
-
25
-
26
-
27
-
28
-
29
-
30
-
31
-
32
-
33
-
34
-
35
-
36
-
37
-
38
-
39
-
40
-
41
-
42
-
43
-
44
-
45
-
46
-
47
-
48
-
49
-
50
-
51
-
52
-
53
-
54
-
55
-
56
-
57
-
58
-
59
-
60
-
61
-
62
-
63
-
64
-
65
-
66
-
67
-
68
-
69
-
 70
70 -
 71
71 -
 72
72 -
 73
73 -
 74
74 -
 75
75 -
 76
76 -
 77
77 -
 78
78 -
 79
79 -
 80
80 -
 81
81 -
 82
82 -
 83
83 -
 84
84 -
 85
85 -
 86
86 -
 87
87 -
 88
88 -
 89
89 -
 90
90 -
91
-
92
-
93
-
94
-
95
-
96
-
97
-
98
-
99
-
100
-
101
-
102
-
103
-
104
-
105
-
106
-
107
-
108
-
109
-
110
-
111
-
112
-
113
-
114
-
115
-
116
-
117
-
118
-
119
-
120
-
121
-
122
-
123
-
124
-
125
-
126
-
127
-
128
-
129
-
130
-
131
-
132
-
133
-
134
-
135
-
136
-
137
-
138
-
139
-
140
-
141
-
142
-
143
-
144
-
145
-
146
-
147
-
148
-
149
-
150
-
151
-
152
-
153
-
154
-
155
-
156
-
157
-
158
-
159
-
160
-
161
-
162
-
163
-
164
-
165
-
166
-
167
-
168
-
169
-
170
-
171
-
172
-
173
-
174
-
175
-
176
-
177
-
178
-
179
-
180
-
181
-
182
-
183
-
184
-
185
-
186
-
187
-
188
-
189
-
190
-
191
-
192
-
193
-
194
-
195
-
196
-
197
-
198
-
199
-
200
-
201
-
202
-
203
-
204
-
205
-
206
-
207
-
208
-
209
-
210
-
211
-
212
-
213
-
214
-
215
-
216
-
217
-
218
-
219
-
220
-
221
-
222
-
223
-
224
-
225
-
226
-
227
-
228
-
229
-
230
-
231
-
232
-
233
-
234
-
235
-
236
-
237
-
238
-
239
-
240
-
241
-
242
-
243
-
244
-
245
-
246
-
247
-
248
-
249
-
250
-
251
-
252
 |
 |

Residential Mortgage
The residential mortgage portfolio, which excludes the discontinued real
estate portfolio acquired with Countrywide, makes up the largest percentage
of our consumer loan portfolio at 40 percent of consumer loans at Decem-
ber 31, 2010. Approximately 14 percent of the residential mortgage portfolio
is in GWIM and represents residential mortgages that are originated for the
home purchase and refinancing needs of our affluent clients. The remaining
portion of the portfolio is mostly in All Other and is comprised of both
residential loans originated for our customers and used in our overall ALM
activities as well as purchased loans.
Outstanding balances in the residential mortgage portfolio increased
$15.8 billion at December 31, 2010 compared to December 31, 2009 as
new FHA insured origination volume was partially offset by paydowns, the sale
of First Republic, transfers to foreclosed properties and charge-offs. In ad-
dition, FHA repurchases of delinquent loans pursuant to our servicing agree-
ments with GNMA also increased the residential mortgage portfolio during
2010. At December 31, 2010 and 2009, the residential mortgage portfolio
included $53.9 billion and $12.9 billion of outstanding loans that were
insured by the FHA. On this portion of the residential mortgage portfolio,
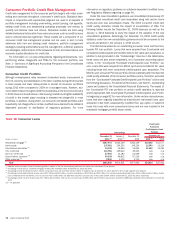
we are protected against principal loss as a result of FHA insurance. The table
below presents certain residential mortgage key credit statistics on both a
reported basis and excluding the Countrywide PCI and FHA insured loan
portfolios. We believe the presentation of information adjusted to exclude the
impacts of the Countrywide PCI and FHA insured loan portfolios is more
representative of the credit risk in this portfolio. For more information on the
Countrywide PCI loan portfolio, see the discussion beginning on page 82.
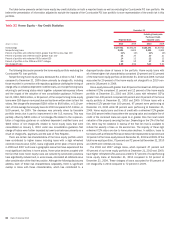
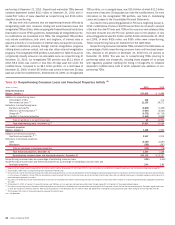
Table 21 Residential Mortgage – Key Credit Statistics
(Dollars in millions)
2010 2009 2010 2009
Reported Basis
Excluding Countrywide
Purchased Credit-impaired
and
FHA Insured Loans
December 31
Outstandings
$257,973
$242,129
$193,435
$218,147
Accruing past due 90 days or more
16,768
11,680
n/a
n/a
Nonperforming loans
17,691
16,596
17,691
16,596
Percent of portfolio with refreshed LTVs greater than 90 but less than 100
15%
12%
10%
11%
Percent of portfolio with refreshed LTVs greater than 100
32
27
23
23
Percent of portfolio with refreshed FICOs below 620
20
17
14
12
Percent of portfolio in the 2006 and 2007 vintages
32
42
38
42
Net charge-off ratio
1.49
1.74
1.79
1.83
n/a = not applicable
The following discussion presents the residential mortgage portfolio ex-
cluding the Countrywide PCI and FHA insured loan portfolios.
We have mitigated a portion of our credit risk on the residential mortgage
portfolio through the use of synthetic securitization vehicles and long-term
standby agreements with FNMA and FHLMC as described in Note 6 – Out-
standing Loans and Leases to the Consolidated Financial Statements. At
December 31, 2010 and 2009, the synthetic securitization vehicles refer-
enced $53.9 billion and $70.7 billion of residential mortgage loans and
provided loss protection up to $1.1 billion and $1.4 billion. At December 31,
2010 and 2009, the Corporation had a receivable of $722 million and
$1.0 billion from these vehicles for reimbursement of losses. The Corporation
records an allowance for credit losses on loans referenced by the synthetic
securitization vehicles. The reported net charge-offs for the residential mort-
gage portfolio do not include the benefit of amounts reimbursable from these
vehicles. Adjusting for the benefit of the credit protection from the synthetic
securitizations, the residential mortgage net charge-off ratio for 2010 would
have been reduced by seven bps compared to 27 bps for 2009. Synthetic
securitizations and the protection provided by FNMA and FHLMC together
mitigated risk on 35 percent of our residential mortgage portfolio at both
December 31, 2010 and 2009. These credit protection agreements reduce
our regulatory risk-weighted assets due to the transfer of a portion of our
credit risk to unaffiliated parties. At December 31, 2010 and 2009, these
transactions had the cumulative effect of reducing our risk-weighted assets by
$8.6 billion and $16.8 billion, and increased our Tier 1 capital ratio by seven
bps and 11 bps and our Tier 1 common capital ratio by five bps and eight bps.
At December 31, 2010 and 2009, $14.3 billion and $6.6 billion in loans were
protected by long-term standby agreements. The Corporation does not record
an allowance for credit losses on loans protected by these long-term standby
agreements.
Nonperforming residential mortgage loans increased $1.1 billion com-
pared to December 31, 2009 as new inflows, which continued to slow in 2010
due to favorable delinquency trends, continued to outpace nonperforming
loans returning to performing status, charge-offs, and paydowns and payoffs.
At December 31, 2010, $12.7 billion, or 72 percent, of the nonperforming
residential mortgage loans were 180 days or more past due and had been
written down to the fair value of the underlying collateral. Net charge-offs
decreased $680 million to $3.7 billion in 2010, or 1.79 percent of total
average residential mortgage loans compared to 1.83 percent for 2009
driven primarily by favorable delinquency trends which were due in part to
improvement in the U.S. economy. Net charge-off ratios were further impacted
by lower loan balances primarily due to paydowns, the sale of First Republic
and charge-offs.
Certain risk characteristics of the residential mortgage portfolio continued
to contribute to higher losses. These characteristics include loans with a high
refreshed loan-to-value (LTV), loans originated at the peak of home prices in
2006 and 2007, loans to borrowers located in California and Florida where we
have concentrations and where significant declines in home prices have been
experienced, as well as interest-only loans. Although the following disclosures
address each of these risk characteristics separately, there is significant
overlap in loans with these characteristics, which contributed to a dispropor-
tionate share of the losses in the portfolio. The residential mortgage loans
with all of these higher risk characteristics comprised five percent and seven
percent of the residential mortgage portfolio at December 31, 2010 and
2009, but accounted for 26 percent of the residential mortgage net charge-
offs in 2010 compared to 31 percent in 2009.
78 Bank of America 2010