Bank of America 2010 Annual Report Download - page 143
Download and view the complete annual report
Please find page 143 of the 2010 Bank of America annual report below. You can navigate through the pages in the report by either clicking on the pages listed below, or by using the keyword search tool below to find specific information within the annual report.-
 1
1 -
2
-
3
-
4
-
5
-
6
-
7
-
8
-
9
-
10
-
11
-
12
-
13
-
14
-
15
-
16
-
17
-
18
-
19
-
20
-
21
-
22
-
23
-
24
-
25
-
26
-
27
-
28
-
29
-
30
-
31
-
32
-
33
-
34
-
35
-
36
-
37
-
38
-
39
-
40
-
41
-
42
-
43
-
44
-
45
-
46
-
47
-
48
-
49
-
50
-
51
-
52
-
53
-
54
-
55
-
56
-
57
-
58
-
59
-
60
-
61
-
62
-
63
-
64
-
65
-
66
-
67
-
68
-
69
-
70
-
71
-
72
-
73
-
74
-
75
-
76
-
77
-
78
-
79
-
80
-
81
-
82
-
83
-
84
-
85
-
86
-
87
-
88
-
89
-
90
-
91
-
92
-
93
-
94
-
95
-
96
-
97
-
98
-
99
-
100
-
101
-
102
-
103
-
104
-
105
-
106
-
107
-
108
-
109
-
110
-
111
-
112
-
113
-
114
-
115
-
116
-
117
-
118
-
119
-
120
-
121
-
122
-
123
-
124
-
125
-
126
-
127
-
128
-
129
-
130
-
131
-
132
-
 133
133 -
 134
134 -
 135
135 -
 136
136 -
 137
137 -
 138
138 -
 139
139 -
 140
140 -
 141
141 -
 142
142 -
 143
143 -
 144
144 -
 145
145 -
 146
146 -
 147
147 -
 148
148 -
 149
149 -
 150
150 -
 151
151 -
 152
152 -
 153
153 -
154
-
155
-
156
-
157
-
158
-
159
-
160
-
161
-
162
-
163
-
164
-
165
-
166
-
167
-
168
-
169
-
170
-
171
-
172
-
173
-
174
-
175
-
176
-
177
-
178
-
179
-
180
-
181
-
182
-
183
-
184
-
185
-
186
-
187
-
188
-
189
-
190
-
191
-
192
-
193
-
194
-
195
-
196
-
197
-
198
-
199
-
200
-
201
-
202
-
203
-
204
-
205
-
206
-
207
-
208
-
209
-
210
-
211
-
212
-
213
-
214
-
215
-
216
-
217
-
218
-
219
-
220
-
221
-
222
-
223
-
224
-
225
-
226
-
227
-
228
-
229
-
230
-
231
-
232
-
233
-
234
-
235
-
236
-
237
-
238
-
239
-
240
-
241
-
242
-
243
-
244
-
245
-
246
-
247
-
248
-
249
-
250
-
251
-
252
 |
 |

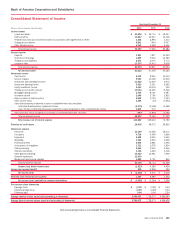
Bank of America Corporation and Subsidiaries
Consolidated Statement of Income
(Dollars in millions, except per share information)
2010 2009 2008
Year Ended December 31
Interest income
Loans and leases
$50,996
$ 48,703 $ 56,017
Debt securities
11,667
12,947 13,146
Federal funds sold and securities borrowed or purchased under agreements to resell
1,832
2,894 3,313
Trading account assets
6,841
7,944 9,057
Other interest income
4,161
5,428 4,151
Total interest income
75,497
77,916 85,684
Interest expense
Deposits
3,997
7,807 15,250
Short-term borrowings
3,699
5,512 12,362
Trading account liabilities
2,571
2,075 2,774
Long-term debt
13,707
15,413 9,938
Total interest expense
23,974
30,807 40,324
Net interest income
51,523
47,109 45,360
Noninterest income
Card income
8,108
8,353 13,314
Service charges
9,390
11,038 10,316
Investment and brokerage services
11,622
11,919 4,972
Investment banking income
5,520
5,551 2,263
Equity investment income
5,260
10,014 539
Trading account profits (losses)
10,054
12,235 (5,911)
Mortgage banking income
2,734
8,791 4,087
Insurance income
2,066
2,760 1,833
Gains on sales of debt securities
2,526
4,723 1,124
Other income (loss)
2,384
(14) (1,654)
Other-than-temporary impairment losses on available-for-sale debt securities:
Total other-than-temporary impairment losses
(2,174)
(3,508) (3,461)
Less: Portion of other-than-temporary impairment losses recognized in other comprehensive income
1,207
672 –
Net impairment losses recognized in earnings on available-for-sale debt securities
(967)
(2,836) (3,461)
Total noninterest income
58,697
72,534 27,422
Total revenue, net of interest expense
110,220
119,643 72,782
Provision for credit losses
28,435
48,570 26,825
Noninterest expense
Personnel
35,149
31,528 18,371
Occupancy
4,716
4,906 3,626
Equipment
2,452
2,455 1,655
Marketing
1,963
1,933 2,368
Professional fees
2,695
2,281 1,592
Amortization of intangibles
1,731
1,978 1,834
Data processing
2,544
2,500 2,546
Telecommunications
1,416
1,420 1,106
Other general operating
16,222
14,991 7,496
Goodwill impairment
12,400
––
Merger and restructuring charges
1,820
2,721 935
Total noninterest expense
83,108
66,713 41,529
Income (loss) before income taxes
(1,323)
4,360 4,428
Income tax expense (benefit)
915
(1,916) 420
Net income (loss)
$ (2,238)
$6,276$4,008
Preferred stock dividends and accretion
1,357
8,480 1,452
Net income (loss) applicable to common shareholders
$ (3,595)
$ (2,204) $ 2,556
Per common share information
Earnings (loss)
$(0.37)
$ (0.29) $ 0.54
Diluted earnings (loss)
(0.37)
(0.29) 0.54
Dividends paid
0.04
0.04 2.24
Average common shares issued and outstanding (in thousands)
9,790,472
7,728,570 4,592,085
Average diluted common shares issued and outstanding (in thousands)
9,790,472
7,728,570 4,596,428
See accompanying Notes to Consolidated Financial Statements.
Bank of America 2010 141