Bank of America 2010 Annual Report Download - page 230
Download and view the complete annual report
Please find page 230 of the 2010 Bank of America annual report below. You can navigate through the pages in the report by either clicking on the pages listed below, or by using the keyword search tool below to find specific information within the annual report.-
 1
1 -
2
-
3
-
4
-
5
-
6
-
7
-
8
-
9
-
10
-
11
-
12
-
13
-
14
-
15
-
16
-
17
-
18
-
19
-
20
-
21
-
22
-
23
-
24
-
25
-
26
-
27
-
28
-
29
-
30
-
31
-
32
-
33
-
34
-
35
-
36
-
37
-
38
-
39
-
40
-
41
-
42
-
43
-
44
-
45
-
46
-
47
-
48
-
49
-
50
-
51
-
52
-
53
-
54
-
55
-
56
-
57
-
58
-
59
-
60
-
61
-
62
-
63
-
64
-
65
-
66
-
67
-
68
-
69
-
70
-
71
-
72
-
73
-
74
-
75
-
76
-
77
-
78
-
79
-
80
-
81
-
82
-
83
-
84
-
85
-
86
-
87
-
88
-
89
-
90
-
91
-
92
-
93
-
94
-
95
-
96
-
97
-
98
-
99
-
100
-
101
-
102
-
103
-
104
-
105
-
106
-
107
-
108
-
109
-
110
-
111
-
112
-
113
-
114
-
115
-
116
-
117
-
118
-
119
-
120
-
121
-
122
-
123
-
124
-
125
-
126
-
127
-
128
-
129
-
130
-
131
-
132
-
133
-
134
-
135
-
136
-
137
-
138
-
139
-
140
-
141
-
142
-
143
-
144
-
145
-
146
-
147
-
148
-
149
-
150
-
151
-
152
-
153
-
154
-
155
-
156
-
157
-
158
-
159
-
160
-
161
-
162
-
163
-
164
-
165
-
166
-
167
-
168
-
169
-
170
-
171
-
172
-
173
-
174
-
175
-
176
-
177
-
178
-
179
-
180
-
181
-
182
-
183
-
184
-
185
-
186
-
187
-
188
-
189
-
190
-
191
-
192
-
193
-
194
-
195
-
196
-
197
-
198
-
199
-
200
-
201
-
202
-
203
-
204
-
205
-
206
-
207
-
208
-
209
-
210
-
211
-
212
-
213
-
214
-
215
-
216
-
217
-
218
-
219
-
 220
220 -
 221
221 -
 222
222 -
 223
223 -
 224
224 -
 225
225 -
 226
226 -
 227
227 -
 228
228 -
 229
229 -
 230
230 -
 231
231 -
 232
232 -
 233
233 -
 234
234 -
 235
235 -
 236
236 -
 237
237 -
 238
238 -
 239
239 -
 240
240 -
241
-
242
-
243
-
244
-
245
-
246
-
247
-
248
-
249
-
250
-
251
-
252
 |
 |

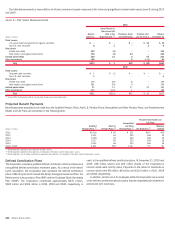
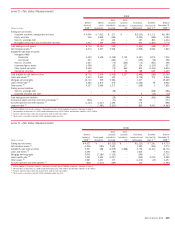
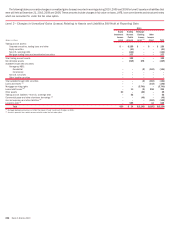
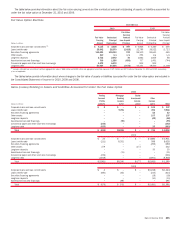
The following tables present a reconciliation of all assets and liabilities measured at fair value on a recurring basis using significant unobservable inputs
(Level 3) during 2010, 2009 and 2008, including net realized and unrealized gains (losses) included in earnings and accumulated OCI.
Level 3 – Fair Value Measurements
(Dollars in millions)
Balance
January 1
2010
(1)
Consolidation
of VIEs
Gains
(Losses)
Included in
Earnings
Gains
(Losses)
Included in
OCI
Purchases,
Issuances
and
Settlements
Gross
Transfers
into
Level 3
(1)
Gross
Transfers
out of
Level 3
(1)
Balance
December 31
2010
(1)
2010
Trading account assets:
Corporate securities, trading loans and other
$11,080 $ 117 $ 848 $ – $ (4,852) $ 2,599 $(2,041) $ 7,751
Equity securities
1,084 – (81) – (342) 131 (169) 623
Non-U.S. sovereign debt
1,143 – (138) – (157) 115 (720) 243
Mortgage trading loans and asset-backed securities
7,770 175 653 – (1,659) 396 (427) 6,908
Total trading account assets
21,077 292 1,282 – (7,010) 3,241 (3,357) 15,525
Net derivative assets
(2)
7,863 – 8,118 – (8,778) 1,067 (525) 7,745
Available-for-sale debt securities:
Agency
– ––– 4–– 4
Non-agency MBS:
Residential
7,216 113 (646) (169) (6,767) 1,909 (188) 1,468
Commercial
258 – (13) (31) (178) 71 (88) 19
Non-U.S. securities
468 – (125) (75) (321) 56 – 3
Corporate/Agency bonds
927 – (3) 47 (847) 32 (19) 137
Other taxable securities
9,854 5,603 (296) 44 (3,263) 1,119 (43) 13,018
Tax-exempt securities
1,623 – (25) (9) (574) 316 (107) 1,224
Total available-for-sale debt securities
20,346 5,716 (1,108) (193) (11,946) 3,503 (445) 15,873
Loans and leases
(3)
4,936 – (89) – (1,526) – – 3,321
Mortgage servicing rights
19,465 – (4,321) – (244) – – 14,900
Loans held-for-sale
(3)
6,942 – 482 – (3,714) 624 (194) 4,140
Other assets
(4)
7,821 – 1,946 – (2,612) – (299) 6,856
Trading account liabilities:
Non-U.S. sovereign debt
(386) – 23 – (17) – 380 –
Corporate securities and other
(10) – (5) – 11 (52) 49 (7)
Total trading account liabilities
(396) – 18 – (6) (52) 429 (7)
Commercial paper and other short-term borrowings
(3)
(707) – (95) – 96 – – (706)
Accrued expenses and other liabilities
(3)
(891) – 146 – (83) – – (828)
Long-term debt
(3)
(4,660) – 697 – 1,074 (1,881) 1,784 (2,986)
(1)
Assets (liabilities). For assets, increase / (decrease) to Level 3 and for liabilities, (increase) / decrease to Level 3.
(2)
Net derivatives at December 31, 2010 include derivative assets of $18.8 billion and derivative liabilities of $11.0 billion.
(3)
Amounts represent items which are accounted for under the fair value option.
(4)
Other assets is primarily comprised of AFS marketable equity securities.
During 2010, the more significant transfers into Level 3 included $3.2 bil-
lion of trading account assets, $3.5 billion of AFS debt securities, $1.1 billion
of net derivative contracts and $1.9 billion of long-term debt. Transfers into
Level 3 for trading account assets were driven by reduced price transparency
as a result of lower levels of trading activity for certain municipal auction rate
securities and corporate debt securities as well as a change in valuation
methodology for certain ABS to a discounted cash flow model. Transfers into
Level 3 for AFS debt securities were due to an increase in the number of non-
agency RMBS and other taxable securities priced using a discounted cash
flow model. Transfers into Level 3 for net derivative contracts were primarily
related to a lack of price observability for certain credit default and total return
swaps. Transfers in and transfers out of Level 3 for long-term debt are
primarily due to changes in the impact of unobservable inputs on the value
of certain equity-linked structured notes.
During 2010, the more significant transfers out of Level 3 were $3.4 billion
of trading account assets and $1.8 billion of long-term debt. Transfers out of
Level 3 for trading account assets were driven by increased price verification
of certain mortgage-backed securities, corporate debt and non-U.S. govern-
ment and agency securities. Transfers out of Level 3 for long-term debt were
the result of a decrease in the significance of unobservable pricing inputs for
certain equity-linked structured notes.
228 Bank of America 2010