Bank of America 2010 Annual Report Download - page 111
Download and view the complete annual report
Please find page 111 of the 2010 Bank of America annual report below. You can navigate through the pages in the report by either clicking on the pages listed below, or by using the keyword search tool below to find specific information within the annual report.-
 1
1 -
2
-
3
-
4
-
5
-
6
-
7
-
8
-
9
-
10
-
11
-
12
-
13
-
14
-
15
-
16
-
17
-
18
-
19
-
20
-
21
-
22
-
23
-
24
-
25
-
26
-
27
-
28
-
29
-
30
-
31
-
32
-
33
-
34
-
35
-
36
-
37
-
38
-
39
-
40
-
41
-
42
-
43
-
44
-
45
-
46
-
47
-
48
-
49
-
50
-
51
-
52
-
53
-
54
-
55
-
56
-
57
-
58
-
59
-
60
-
61
-
62
-
63
-
64
-
65
-
66
-
67
-
68
-
69
-
70
-
71
-
72
-
73
-
74
-
75
-
76
-
77
-
78
-
79
-
80
-
81
-
82
-
83
-
84
-
85
-
86
-
87
-
88
-
89
-
90
-
91
-
92
-
93
-
94
-
95
-
96
-
97
-
98
-
99
-
100
-
 101
101 -
 102
102 -
 103
103 -
 104
104 -
 105
105 -
 106
106 -
 107
107 -
 108
108 -
 109
109 -
 110
110 -
 111
111 -
 112
112 -
 113
113 -
 114
114 -
 115
115 -
 116
116 -
 117
117 -
 118
118 -
 119
119 -
 120
120 -
 121
121 -
122
-
123
-
124
-
125
-
126
-
127
-
128
-
129
-
130
-
131
-
132
-
133
-
134
-
135
-
136
-
137
-
138
-
139
-
140
-
141
-
142
-
143
-
144
-
145
-
146
-
147
-
148
-
149
-
150
-
151
-
152
-
153
-
154
-
155
-
156
-
157
-
158
-
159
-
160
-
161
-
162
-
163
-
164
-
165
-
166
-
167
-
168
-
169
-
170
-
171
-
172
-
173
-
174
-
175
-
176
-
177
-
178
-
179
-
180
-
181
-
182
-
183
-
184
-
185
-
186
-
187
-
188
-
189
-
190
-
191
-
192
-
193
-
194
-
195
-
196
-
197
-
198
-
199
-
200
-
201
-
202
-
203
-
204
-
205
-
206
-
207
-
208
-
209
-
210
-
211
-
212
-
213
-
214
-
215
-
216
-
217
-
218
-
219
-
220
-
221
-
222
-
223
-
224
-
225
-
226
-
227
-
228
-
229
-
230
-
231
-
232
-
233
-
234
-
235
-
236
-
237
-
238
-
239
-
240
-
241
-
242
-
243
-
244
-
245
-
246
-
247
-
248
-
249
-
250
-
251
-
252
 |
 |

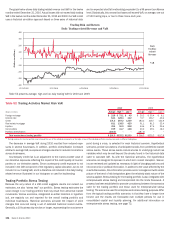
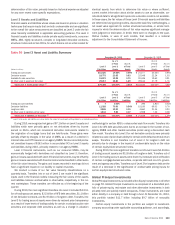
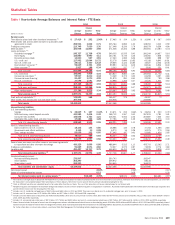
The table below includes derivatives utilized in our ALM activities including
those designated as accounting and economic hedging instruments. The fair
value of net ALM contracts increased $329 million to a gain of $12.6 billion at
December 31, 2010 compared to $12.3 billion at December 31, 2009. The
increase was primarily attributable to changes in the value of U.S. dollar-
denominated receive-fixed interest rate swaps of $3.3 billion, foreign ex-
change contracts of $2.1 billion and foreign exchange basis swaps of
$197 million. The increase was partially offset by a loss from the changes
in the value of pay-fixed interest rate swaps of $5.0 billion and option products
of $294 million.
Table 55 Asset and Liability Management Interest Rate and Foreign Exchange Contracts
(Dollars in millions, average estimated duration in years)
Fair
Value Total 2011 2012 2013 2014 2015 Thereafter
Average
Estimated
Duration
Expected Maturity
December 31, 2010
Receive fixed interest rate swaps
(1, 2)
$7,364 4.45
Notional amount
$104,949 $ 8 $36,201 $ 7,909 $ 7,270 $ 8,094 $45,467
Weighted-average fixed-rate
3.94% 1.00% 2.49% 3.90% 3.66% 3.71% 5.19%
Pay fixed interest rate swaps
(1, 2)
(3,827) 6.03
Notional amount
$156,067 $50,810 $16,205 $ 1,207 $ 4,712 $10,933 $72,200
Weighted-average fixed-rate
3.02% 2.37% 2.15% 2.88% 2.40% 2.75% 3.76%
Same-currency basis swaps
(3)
103
Notional amount
$152,849 $13,449 $49,509 $31,503 $21,085 $11,431 $25,872
Foreign exchange basis swaps
(2, 4, 5)
4,830
Notional amount
235,164 21,936 39,365 46,380 41,003 23,430 63,050
Option products
(6)
(120)
Notional amount
(8)
6,572 (1,180) 2,092 2,390 603 311 2,356
Foreign exchange contracts
(2, 5, 7)
4,272
Notional amount
(8)
109,544 59,508 5,427 10,048 13,035 2,372 19,154
Futures and forward rate contracts
(21)
Notional amount
(8)
(280)(280)–––– –
Net ALM contracts $12,601
(Dollars in millions, average estimated duration in years)
Fair
Value Total 2010 2011 2012 2013 2014 Thereafter
Average
Estimated
Duration
Expected Maturity
December 31, 2009
Receive fixed interest rate swaps
(1, 2)
$4,047 4.34
Notional amount $110,597 $15,212 $ 8 $35,454 $ 7,333 $ 8,247 $44,343
Weighted-average fixed-rate 3.65% 1.61% 1.00% 2.42% 4.06% 3.48% 5.29%
Pay fixed interest rate swaps
(1, 2)
1,175 4.18
Notional amount $104,445 $ 2,500 $50,810 $14,688 $ 806 $ 3,729 $31,912
Weighted-average fixed-rate 2.83% 1.82% 2.37% 2.24% 3.77% 2.61% 3.92%
Same-currency basis swaps
(3)
107
Notional amount $ 42,881 $ 4,549 $ 8,593 $11,934 $ 5,591 $ 5,546 $ 6,668
Foreign exchange basis swaps
(2, 4, 5)
4,633
Notional amount 122,807 7,958 10,968 19,862 18,322 31,853 33,844
Option products
(6)
174
Notional amount
(8)
6,540 656 2,031 1,742 244 603 1,264
Foreign exchange contracts
(2, 5, 7)
2,144
Notional amount
(8)
103,726 63,158 3,491 3,977 6,795 10,585 15,720
Futures and forward rate contracts (8)
Notional amount
(8)
10,55910,559–––– –
Net ALM contracts
$12,272
(1)
At December 31, 2010 and 2009, the receive-fixed interest rate swap notional amounts that represented forward starting swaps and will not be effective until their respective contractual start dates were $1.7 billion and $2.5 billion,
and the forward starting pay-fixed swap positions were $34.5 billion and $76.8 billion.
(2)
Does not include basis adjustments on either fixed-rate debt issued by the Corporation or AFS debt securities which are hedged in fair value hedge relationships using derivatives designated as hedging instruments that substantially
offset the fair values of these derivatives.
(3)
At December 31, 2010 and 2009, same-currency basis swaps consist of $152.8 billion and $42.9 billion in both foreign currency and U.S. dollar-denominated basis swaps in which both sides of the swap are in the same currency.
(4)
Foreign exchange basis swaps consisted of cross-currency variable interest rate swaps used separately or in conjunction with receive-fixed interest rate swaps.
(5)
Does not include foreign currency translation adjustments on certain non-U.S. debt issued by the Corporation which substantially offset the fair values of these derivatives.
(6)
Option products of $6.6 billion at December 31, 2010 are comprised of $160 million in purchased caps/floors, $8.2 billion in swaptions and $(1.8) billion in foreign exchange options. Option products of $6.5 billion at December 31,
2009 are comprised of $177 million in purchased caps/floors and $6.3 billion in swaptions.
(7)
Foreign exchange contracts include foreign currency-denominated and cross-currency receive-fixed interest rate swaps as well as foreign currency forward rate contracts. Total notional amount was comprised of $57.6 billion in foreign
currency-denominated and cross-currency receive-fixed swaps and $52.0 billion in foreign currency forward rate contracts at December 31, 2010, and $46.0 billion in foreign currency-denominated and cross-currency receive-fixed
swaps and $57.7 billion in foreign currency forward rate contracts at December 31, 2009.
(8)
Reflects the net of long and short positions.
We use interest rate derivative instruments to hedge the variability in the
cash flows of our assets and liabilities, including certain compensation costs
and other forecasted transactions (collectively referred to as cash flow
hedges). The net losses on both open and terminated derivative instruments
recorded in accumulated OCI, net-of-tax, were $3.2 billion and $2.5 billion at
December 31, 2010 and 2009. These net losses are expected to be reclas-
sified into earnings in the same period as the hedged cash flows affect
earnings and will decrease income or increase expense on the respective
hedged cash flows. Assuming no change in open cash flow derivative hedge
positions and no changes to prices or interest rates beyond what is implied in
forward yield curves at December 31, 2010 the pre-tax net losses are
expected to be reclassified into earnings as follows: $1.8 billion, or 35 percent
within the next year, 80 percent within five years, and 92 percent within
10 years, with the remaining eight percent thereafter. For more information on
derivatives designated as cash flow hedges, see Note 4 – Derivatives to the
Consolidated Financial Statements.
Bank of America 2010 109