Bank of America 2010 Annual Report Download - page 166
Download and view the complete annual report
Please find page 166 of the 2010 Bank of America annual report below. You can navigate through the pages in the report by either clicking on the pages listed below, or by using the keyword search tool below to find specific information within the annual report.-
 1
1 -
2
-
3
-
4
-
5
-
6
-
7
-
8
-
9
-
10
-
11
-
12
-
13
-
14
-
15
-
16
-
17
-
18
-
19
-
20
-
21
-
22
-
23
-
24
-
25
-
26
-
27
-
28
-
29
-
30
-
31
-
32
-
33
-
34
-
35
-
36
-
37
-
38
-
39
-
40
-
41
-
42
-
43
-
44
-
45
-
46
-
47
-
48
-
49
-
50
-
51
-
52
-
53
-
54
-
55
-
56
-
57
-
58
-
59
-
60
-
61
-
62
-
63
-
64
-
65
-
66
-
67
-
68
-
69
-
70
-
71
-
72
-
73
-
74
-
75
-
76
-
77
-
78
-
79
-
80
-
81
-
82
-
83
-
84
-
85
-
86
-
87
-
88
-
89
-
90
-
91
-
92
-
93
-
94
-
95
-
96
-
97
-
98
-
99
-
100
-
101
-
102
-
103
-
104
-
105
-
106
-
107
-
108
-
109
-
110
-
111
-
112
-
113
-
114
-
115
-
116
-
117
-
118
-
119
-
120
-
121
-
122
-
123
-
124
-
125
-
126
-
127
-
128
-
129
-
130
-
131
-
132
-
133
-
134
-
135
-
136
-
137
-
138
-
139
-
140
-
141
-
142
-
143
-
144
-
145
-
146
-
147
-
148
-
149
-
150
-
151
-
152
-
153
-
154
-
155
-
 156
156 -
 157
157 -
 158
158 -
 159
159 -
 160
160 -
 161
161 -
 162
162 -
 163
163 -
 164
164 -
 165
165 -
 166
166 -
 167
167 -
 168
168 -
 169
169 -
 170
170 -
 171
171 -
 172
172 -
 173
173 -
 174
174 -
 175
175 -
 176
176 -
177
-
178
-
179
-
180
-
181
-
182
-
183
-
184
-
185
-
186
-
187
-
188
-
189
-
190
-
191
-
192
-
193
-
194
-
195
-
196
-
197
-
198
-
199
-
200
-
201
-
202
-
203
-
204
-
205
-
206
-
207
-
208
-
209
-
210
-
211
-
212
-
213
-
214
-
215
-
216
-
217
-
218
-
219
-
220
-
221
-
222
-
223
-
224
-
225
-
226
-
227
-
228
-
229
-
230
-
231
-
232
-
233
-
234
-
235
-
236
-
237
-
238
-
239
-
240
-
241
-
242
-
243
-
244
-
245
-
246
-
247
-
248
-
249
-
250
-
251
-
252
 |
 |
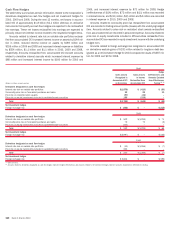
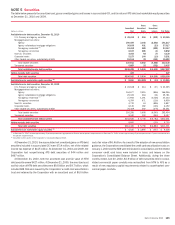
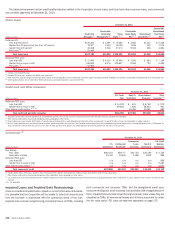
The notional amount represents the maximum amount payable by the
Corporation for most credit derivatives. However, the Corporation does not
solely monitor its exposure to credit derivatives based on notional amount
because this measure does not take into consideration the probability of
occurrence. As such, the notional amount is not a reliable indicator of the
Corporation’s exposure to these contracts. Instead, a risk framework is used
to define risk tolerances and establish limits to help ensure that certain credit
risk-related losses occur within acceptable, predefined limits.
The Corporation economically hedges its market risk exposure to credit
derivatives by entering into a variety of offsetting derivative contracts and
security positions. For example, in certain instances, the Corporation may
purchase credit protection with identical underlying referenced names to
offset its exposure. The carrying amount and notional amount of written
credit derivatives for which the Corporation held purchased credit derivatives
with identical underlying referenced names and terms at December 31, 2010
was $43.7 billion and $1.4 trillion compared to $79.4 billion and $2.3 trillion
at December 31, 2009.
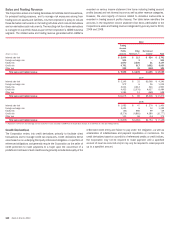
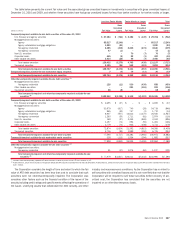
Credit-related notes in the table on page 163 include investments in
securities issued by CDOs, CLOs and credit-linked note vehicles. These
instruments are classified as trading securities. The carrying value of these
instruments equals the Corporation’s maximum exposure to loss. The Cor-
poration is not obligated to make any payments to the entities under the
terms of the securities owned. The Corporation discloses internal categori-
zations (i.e., investment-grade, non-investment grade) consistent with how
risk is managed for these instruments.
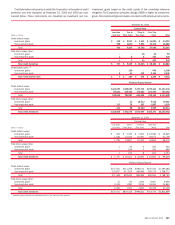
Credit Risk Management of Derivatives and
Credit-related Contingent Features
The Corporation executes the majority of its derivative contracts in the
over-the-counter market with large, international financial institutions, includ-
ing broker/dealers and, to a lesser degree, with a variety of non-financial
companies. Substantially all of the derivative transactions are executed on a
daily margin basis. Therefore, events such as a credit ratings downgrade
(depending on the ultimate rating level) or a breach of credit covenants would
typically require an increase in the amount of collateral required of the
counterparty, where applicable, and/or allow the Corporation to take addi-
tional protective measures such as early termination of all trades. Further, as
previously described on page 157, the Corporation enters into legally en-
forceable master netting agreements which reduce risk by permitting the
closeout and netting of transactions with the same counterparty upon the
occurrence of certain events.
Substantially all of the Corporation’s derivative contracts contain credit
risk-related contingent features, primarily in the form of International Swaps
and Derivatives Association, Inc. (ISDA) master agreements that enhance the
creditworthiness of these instruments compared to other obligations of the
respective counterparty with whom the Corporation has transacted (e.g.,
other debt or equity). These contingent features may be for the benefit of
the Corporation as well as its counterparties with respect to changes in the
Corporation’s creditworthiness. At December 31, 2010 and 2009, the Cor-
poration held cash and securities collateral of $76.0 billion and $67.7 billion,
and posted cash and securities collateral of $61.2 billion and $62.2 billion in
the normal course of business under derivative agreements.
In connection with certain over-the-counter derivative contracts and other
trading agreements, the Corporation could be required to provide additional
collateral or to terminate transactions with certain counterparties in the event
of a downgrade of the senior debt ratings of Bank of America Corporation and
its subsidiaries. The amount of additional collateral required depends on the
contract and is usually a fixed incremental amount and/or the market value of
the exposure. At December 31, 2010 and 2009, the amount of additional
collateral and termination payments that would have been required for such
derivatives and trading agreements was approximately $1.2 billion and
$2.1 billion if the long-term credit rating of the Corporation was incrementally
downgraded by one level by all ratings agencies. At December 31, 2010 and
2009, a second incremental one level downgrade by the ratings agencies
would have required approximately $1.1 billion and $1.2 billion in additional
collateral and termination payments.
The Corporation records counterparty credit risk valuation adjustments on
derivative assets in order to properly reflect the credit quality of the counter-
party. These adjustments are necessary as the market quotes on derivatives
do not fully reflect the credit risk of the counterparties to the derivative assets.
The Corporation considers collateral and legally enforceable master netting
agreements that mitigate its credit exposure to each counterparty in deter-
mining the counterparty credit risk valuation adjustment. All or a portion of
these counterparty credit risk valuation adjustments can be reversed or
otherwise adjusted in future periods due to changes in the value of the
derivative contract, collateral and creditworthiness of the counterparty. During
2010 and 2009, credit valuation gains (losses) of $731 million and $3.1 bil-
lion ($(8) million and $1.7 billion, net of hedges) for counterparty credit risk
related to derivative assets were recognized in trading account profits
(losses). At December 31, 2010 and 2009, the cumulative counterparty
credit risk valuation adjustment reduced the derivative assets balance by
$6.8 billion and $7.9 billion.
In addition, the fair value of the Corporation’s or its subsidiaries’ derivative
liabilities is adjusted to reflect the impact of the Corporation’s credit quality.
During 2010 and 2009, credit valuation gains (losses) of $331 million and
$(662) million ($262 million and $(662) million, net of hedges) were recog-
nized in trading account profits (losses) for changes in the Corporation’s or its
subsidiaries’ credit risk. At December 31, 2010 and 2009, the Corporation’s
cumulative credit risk valuation adjustment reduced the derivative liabilities
balance by $1.1 billion and $732 million.
164 Bank of America 2010