Bank of America 2010 Annual Report Download - page 61
Download and view the complete annual report
Please find page 61 of the 2010 Bank of America annual report below. You can navigate through the pages in the report by either clicking on the pages listed below, or by using the keyword search tool below to find specific information within the annual report.-
 1
1 -
2
-
3
-
4
-
5
-
6
-
7
-
8
-
9
-
10
-
11
-
12
-
13
-
14
-
15
-
16
-
17
-
18
-
19
-
20
-
21
-
22
-
23
-
24
-
25
-
26
-
27
-
28
-
29
-
30
-
31
-
32
-
33
-
34
-
35
-
36
-
37
-
38
-
39
-
40
-
41
-
42
-
43
-
44
-
45
-
46
-
47
-
48
-
49
-
50
-
 51
51 -
 52
52 -
 53
53 -
 54
54 -
 55
55 -
 56
56 -
 57
57 -
 58
58 -
 59
59 -
 60
60 -
 61
61 -
 62
62 -
 63
63 -
 64
64 -
 65
65 -
 66
66 -
 67
67 -
 68
68 -
 69
69 -
 70
70 -
 71
71 -
72
-
73
-
74
-
75
-
76
-
77
-
78
-
79
-
80
-
81
-
82
-
83
-
84
-
85
-
86
-
87
-
88
-
89
-
90
-
91
-
92
-
93
-
94
-
95
-
96
-
97
-
98
-
99
-
100
-
101
-
102
-
103
-
104
-
105
-
106
-
107
-
108
-
109
-
110
-
111
-
112
-
113
-
114
-
115
-
116
-
117
-
118
-
119
-
120
-
121
-
122
-
123
-
124
-
125
-
126
-
127
-
128
-
129
-
130
-
131
-
132
-
133
-
134
-
135
-
136
-
137
-
138
-
139
-
140
-
141
-
142
-
143
-
144
-
145
-
146
-
147
-
148
-
149
-
150
-
151
-
152
-
153
-
154
-
155
-
156
-
157
-
158
-
159
-
160
-
161
-
162
-
163
-
164
-
165
-
166
-
167
-
168
-
169
-
170
-
171
-
172
-
173
-
174
-
175
-
176
-
177
-
178
-
179
-
180
-
181
-
182
-
183
-
184
-
185
-
186
-
187
-
188
-
189
-
190
-
191
-
192
-
193
-
194
-
195
-
196
-
197
-
198
-
199
-
200
-
201
-
202
-
203
-
204
-
205
-
206
-
207
-
208
-
209
-
210
-
211
-
212
-
213
-
214
-
215
-
216
-
217
-
218
-
219
-
220
-
221
-
222
-
223
-
224
-
225
-
226
-
227
-
228
-
229
-
230
-
231
-
232
-
233
-
234
-
235
-
236
-
237
-
238
-
239
-
240
-
241
-
242
-
243
-
244
-
245
-
246
-
247
-
248
-
249
-
250
-
251
-
252
 |
 |

governing securitization documents, which may include use by the securiti-
zation trust to repay any outstanding monoline advances or reduce future
advances from the monolines. To the extent that a monoline has not advanced
funds or does not anticipate that it will be required to advance funds to the
securitization trust, the likelihood of receiving a repurchase request from a
monoline may be reduced as the monoline would receive limited or no benefit
from the payment of repurchase claims. Moreover, some monolines are not
currently performing their obligations under the financial guaranty policies
they issued which may, in certain circumstances, impact their ability to
present repurchase claims.
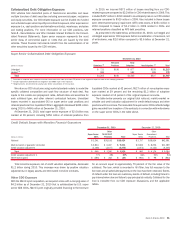
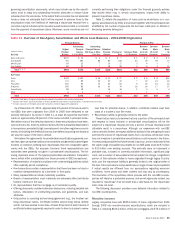
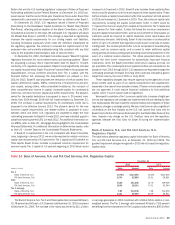
Table 11 details the population of loans sold as whole-loans or in non-
agency securitizations by entity and product together with the principal at-risk
stratified by the number of payments the borrower made prior to default or
becoming severely delinquent.
Table 11 Overview of Non-Agency Securitization and Whole Loan Balances – 2004-2008 Originations
(Dollars in billions)
By Entity
Original
Principal
Balance
Outstanding
Principal
Balance
12/31/2010
Outstanding
Principal Balance
180 Days or More
Past Due
Defaulted
Principal
Balance
Principal at
Risk
Borrower Made
G13 Payments
Borrower
Made
13 to 24
Payments
Borrower
Made
25 to 36
Payments
Borrower
Made
H36
Payments
Principal Balance Principal at Risk
Bank of America $ 100 $ 34 $ 4 $ 3 $ 7 $ 1 $ 2 $ 2 $ 2
Countrywide 716 293 86 80 166 24 46 49 47
Merrill Lynch 65 22 7 10 17 3 4 3 7
First Franklin 82 23 7 19 26 4 6 4 12
Total
(1, 2, 3)
$963 $372 $104 $112 $216 $32 $58 $58 $68
By Product
Prime $ 302 $ 124 $ 16 $ 11 $ 27 $ 2 $ 6 $ 8 $11
Alt-A 172 82 22 21 43 7 12 12 12
Pay option 150 65 30 20 50 5 15 16 14
Subprime 245 82 36 43 79 16 19 17 27
Home Equity 88 18 – 16 16 2 5 5 4
Other 6 1 – 1 1 – 1 – –
Total $963 $372 $104 $112 $216 $32 $58 $58 $68
(1)
Includes $186 billion of original principal balance related to transactions with monoline participation.
(2)
Excludes transactions sponsored by Bank of America and Merrill Lynch where no representations or warranties were assumed.
(3)
Includes exposures on third-party sponsored transactions related to legacy entity originations.
As of December 31, 2010, approximately 22 percent of the loans sold to
non-GSEs that were originated from 2004 to 2008 have defaulted or are
severely delinquent. As shown in Table 11, at least 25 payments have been
made on approximately 58 percent of the loans included in principal at-risk.
We believe many of the defaults observed in these securitizations have been,
and continue to be, driven by external factors like the substantial depreciation
in home prices, persistently high unemployment and other negative economic
trends, diminishing the likelihood that any loan defect (assuming one exists at
all) was the cause of the loan’s default.
We believe the agreements for private-label securitizations generally con-
tain less rigorous representations and warranties and generally impose higher
burdens on investors seeking loan repurchases than the comparable agree-
ments with the GSEs. For example, borrower fraud representations and
warranties were generally not given in private-label securitizations. The fol-
lowing represent some of the typical private-label securitization transaction
terms (which differ substantially from those provided in GSE transactions):
• Representation of material compliance with underwriting guidelines (which
often explicitly permit exceptions).
• Few transactions contain a representation that there has been no fraud or
material misrepresentation by a borrower or third party.
• Many representations include materiality qualifiers.
• Breach of representation must materially and adversely affect certificate
holders’ interest in the loan.
• No representation that the mortgage is of investment quality.
• Offering documents included extensive disclosures, including detailed risk
factors, description of underwriting practices and guidelines, and loan
attributes.
• Only parties to a pooling and servicing agreement (e.g., the trustee) can
bring repurchase claims. Certificate holders cannot bring claims directly
and do not have access to loan files. At least 25 percent of each tranche of
certificate holders is generally required in order to direct a trustee to review
loan files for potential claims. In addition, certificate holders must bear
costs of a trustee’s loan file review.
• Repurchase liability is generally limited to the seller.
These factors lead us to believe that only a portion of the principal at-risk
with respect to loans included in private-label securitizations will be the
subject of a repurchase request and only a portion of those requests would
ultimately result in a repurchase. Although our experience with non-GSE
claims remains limited, we expect additional activity in this area going forward
and that the volume of repurchase claims from monolines, whole-loan inves-
tors and investors in private-label securitizations could increase in the future.
It is reasonably possible that future losses may occur, and our estimate is that
the upper range of possible loss related to non-GSE sales could be $7 billion
to $10 billion over existing accruals. This estimate does not represent a
probable loss, is based on currently available information, significant judg-
ment, and a number of assumptions that are subject to change. A significant
portion of this estimate relates to loans originated through legacy Country-
wide, and the repurchase liability is generally limited to the original seller of
the loan. Future provisions and possible loss or range of loss may be impacted
if actual results are different from our assumptions regarding economic
conditions, home prices and other matters and may vary by counterparty.
The resolution of the repurchase claims process with the non-GSE counter-
parties will likely be a protracted process, and we will vigorously contest any
request for repurchase if we conclude that a valid basis for the repurchase
claim does not exist.
The following discussion provides more detailed information related to
non-GSE counterparties.
Monoline Insurers
Legacy companies have sold $185.6 billion of loans originated from 2004
through 2008 into monoline-insured securitizations, which are included in
Table 11, including $106.2 billion of first-lien mortgages and $79.4 billion of
Bank of America 2010 59