Bank of America 2010 Annual Report Download - page 221
Download and view the complete annual report
Please find page 221 of the 2010 Bank of America annual report below. You can navigate through the pages in the report by either clicking on the pages listed below, or by using the keyword search tool below to find specific information within the annual report.-
 1
1 -
2
-
3
-
4
-
5
-
6
-
7
-
8
-
9
-
10
-
11
-
12
-
13
-
14
-
15
-
16
-
17
-
18
-
19
-
20
-
21
-
22
-
23
-
24
-
25
-
26
-
27
-
28
-
29
-
30
-
31
-
32
-
33
-
34
-
35
-
36
-
37
-
38
-
39
-
40
-
41
-
42
-
43
-
44
-
45
-
46
-
47
-
48
-
49
-
50
-
51
-
52
-
53
-
54
-
55
-
56
-
57
-
58
-
59
-
60
-
61
-
62
-
63
-
64
-
65
-
66
-
67
-
68
-
69
-
70
-
71
-
72
-
73
-
74
-
75
-
76
-
77
-
78
-
79
-
80
-
81
-
82
-
83
-
84
-
85
-
86
-
87
-
88
-
89
-
90
-
91
-
92
-
93
-
94
-
95
-
96
-
97
-
98
-
99
-
100
-
101
-
102
-
103
-
104
-
105
-
106
-
107
-
108
-
109
-
110
-
111
-
112
-
113
-
114
-
115
-
116
-
117
-
118
-
119
-
120
-
121
-
122
-
123
-
124
-
125
-
126
-
127
-
128
-
129
-
130
-
131
-
132
-
133
-
134
-
135
-
136
-
137
-
138
-
139
-
140
-
141
-
142
-
143
-
144
-
145
-
146
-
147
-
148
-
149
-
150
-
151
-
152
-
153
-
154
-
155
-
156
-
157
-
158
-
159
-
160
-
161
-
162
-
163
-
164
-
165
-
166
-
167
-
168
-
169
-
170
-
171
-
172
-
173
-
174
-
175
-
176
-
177
-
178
-
179
-
180
-
181
-
182
-
183
-
184
-
185
-
186
-
187
-
188
-
189
-
190
-
191
-
192
-
193
-
194
-
195
-
196
-
197
-
198
-
199
-
200
-
201
-
202
-
203
-
204
-
205
-
206
-
207
-
208
-
209
-
210
-
 211
211 -
 212
212 -
 213
213 -
 214
214 -
 215
215 -
 216
216 -
 217
217 -
 218
218 -
 219
219 -
 220
220 -
 221
221 -
 222
222 -
 223
223 -
 224
224 -
 225
225 -
 226
226 -
 227
227 -
 228
228 -
 229
229 -
 230
230 -
 231
231 -
232
-
233
-
234
-
235
-
236
-
237
-
238
-
239
-
240
-
241
-
242
-
243
-
244
-
245
-
246
-
247
-
248
-
249
-
250
-
251
-
252
 |
 |

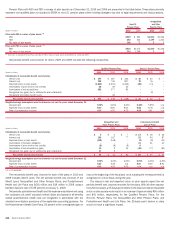
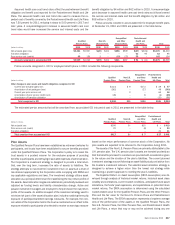
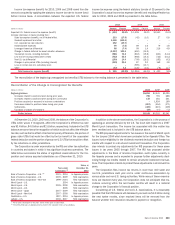
Fair Value Measurements
For information on fair value measurements, including descriptions of Level 1, 2 and 3 of the fair value hierarchy and the valuation methods employed bythe
Corporation, see Note 1 – Summary of Significant Accounting Principles and Note 22 – Fair Value Measurements.
Plan investment assets measured at fair value by level and in total at December 31, 2010 and 2009 are summarized in the table below.
(Dollars in millions)
Level 1 Level 2 Level 3 Total
Fair Value Measurements
December 31, 2010
Cash and short-term investments
Money market and interest-bearing cash
$ 1,469 $ – $ – $ 1,469
Cash and cash equivalent commingled/mutual funds
–45–45
Fixed income
U.S. government and government agency securities
701 2,604 14 3,319
Corporate debt securities
– 1,106 – 1,106
Asset-backed securities
– 796 – 796
Non-U.S. debt securities
36 397 9 442
Fixed income commingled/mutual funds
240 1,359 – 1,599
Equity
Common and preferred equity securities
6,980 1 – 6,981
Equity commingled/mutual funds
637 2,307 – 2,944
Public real estate investment trusts
– 168 – 168
Real estate
Private real estate
––110110
Real estate commingled/mutual funds
30 2 215 247
Limited partnerships – 101 230 331
Other investments
(1)
19 258 83 360
Total plan investment assets, at fair value $10,112 $9,144 $661 $19,917
December 31, 2009
Cash and short-term investments
Money market and interest-bearing cash $ 1,311 $ – $ – $ 1,311
Cash and cash equivalent commingled/mutual funds – 18 – 18
Fixed income
U.S. government and government agency securities 1,460 1,422 – 2,882
Corporate debt securities 22 1,279 – 1,301
Asset-backed securities – 1,116 – 1,116
Non-U.S. debt securities 278 601 6 885
Fixed income commingled/mutual funds 57 1,202 – 1,259
Equity
Common and preferred equity securities 6,077 – – 6,077
Equity commingled/mutual funds 697 2,026 – 2,723
Public real estate investment trusts – 116 – 116
Real estate
Private real estate ––119119
Real estate commingled/mutual funds 23 – 195 218
Limited partnerships
– 91 162 253
Other investments
(1)
1 20 188 209
Total plan investment assets, at fair value
$ 9,926 $7,891 $670 $18,487
(1)
Other investments represent interest rate swaps of $198 million and $110 million, participant loans of $79 million and $74 million, commodity and balanced funds of $44 million and $14 million and other various investments of
$39 million and $11 million at December 31, 2010 and 2009.
Bank of America 2010 219