Bank of America 2010 Annual Report Download - page 129
Download and view the complete annual report
Please find page 129 of the 2010 Bank of America annual report below. You can navigate through the pages in the report by either clicking on the pages listed below, or by using the keyword search tool below to find specific information within the annual report.-
 1
1 -
2
-
3
-
4
-
5
-
6
-
7
-
8
-
9
-
10
-
11
-
12
-
13
-
14
-
15
-
16
-
17
-
18
-
19
-
20
-
21
-
22
-
23
-
24
-
25
-
26
-
27
-
28
-
29
-
30
-
31
-
32
-
33
-
34
-
35
-
36
-
37
-
38
-
39
-
40
-
41
-
42
-
43
-
44
-
45
-
46
-
47
-
48
-
49
-
50
-
51
-
52
-
53
-
54
-
55
-
56
-
57
-
58
-
59
-
60
-
61
-
62
-
63
-
64
-
65
-
66
-
67
-
68
-
69
-
70
-
71
-
72
-
73
-
74
-
75
-
76
-
77
-
78
-
79
-
80
-
81
-
82
-
83
-
84
-
85
-
86
-
87
-
88
-
89
-
90
-
91
-
92
-
93
-
94
-
95
-
96
-
97
-
98
-
99
-
100
-
101
-
102
-
103
-
104
-
105
-
106
-
107
-
108
-
109
-
110
-
111
-
112
-
113
-
114
-
115
-
116
-
117
-
118
-
 119
119 -
 120
120 -
 121
121 -
 122
122 -
 123
123 -
 124
124 -
 125
125 -
 126
126 -
 127
127 -
 128
128 -
 129
129 -
 130
130 -
 131
131 -
 132
132 -
 133
133 -
 134
134 -
 135
135 -
 136
136 -
 137
137 -
 138
138 -
 139
139 -
140
-
141
-
142
-
143
-
144
-
145
-
146
-
147
-
148
-
149
-
150
-
151
-
152
-
153
-
154
-
155
-
156
-
157
-
158
-
159
-
160
-
161
-
162
-
163
-
164
-
165
-
166
-
167
-
168
-
169
-
170
-
171
-
172
-
173
-
174
-
175
-
176
-
177
-
178
-
179
-
180
-
181
-
182
-
183
-
184
-
185
-
186
-
187
-
188
-
189
-
190
-
191
-
192
-
193
-
194
-
195
-
196
-
197
-
198
-
199
-
200
-
201
-
202
-
203
-
204
-
205
-
206
-
207
-
208
-
209
-
210
-
211
-
212
-
213
-
214
-
215
-
216
-
217
-
218
-
219
-
220
-
221
-
222
-
223
-
224
-
225
-
226
-
227
-
228
-
229
-
230
-
231
-
232
-
233
-
234
-
235
-
236
-
237
-
238
-
239
-
240
-
241
-
242
-
243
-
244
-
245
-
246
-
247
-
248
-
249
-
250
-
251
-
252
 |
 |

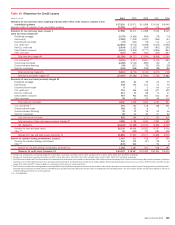
Table VIII Allocation of the Allowance for Credit Losses by Product Type
(Dollars in millions)
Amount
Percent
of Total Amount
Percent
of Total Amount
Percent
of Total Amount
Percent
of Total Amount
Percent
of Total
2010 2009 2008 2007 2006
December 31
Allowance for loan and lease losses
(1)
Residential mortgage
$ 4,648 11.10%
$ 4,607 12.38% $ 1,382 5.99% $ 207 1.79% $ 248 2.75%
Home equity
12,934 30.88
10,160 27.31 5,385 23.34 963 8.31 133 1.48
Discontinued real estate
1,670 3.99
989 2.66 658 2.85 n/a n/a n/a n/a
U.S. credit card
10,876 25.97
6,017 16.18 3,947 17.11 2,919 25.19 3,176 35.23
Non-U.S. credit card
2,045 4.88
1,581 4.25 742 3.22 441 3.81 336 3.73
Direct/Indirect consumer
2,381 5.68
4,227 11.36 4,341 18.81 2,077 17.92 1,378 15.28
Other consumer
161 0.38
204 0.55 203 0.88 151 1.30 289 3.20
Total consumer
34,715 82.88
27,785 74.69 16,658 72.20 6,758 58.32 5,560 61.67
U.S. commercial
(2)
3,576 8.54
5,152 13.85 4,339 18.81 3,194 27.56 2,162 23.98
Commercial real estate
3,137 7.49
3,567 9.59 1,465 6.35 1,083 9.35 588 6.52
Commercial lease financing
126 0.30
291 0.78 223 0.97 218 1.88 217 2.41
Non-U.S. commercial
331 0.79
405 1.09 386 1.67 335 2.89 489 5.42
Total commercial
(3)
7,170 17.12
9,415 25.31 6,413 27.80 4,830 41.68 3,456 38.33
Allowance for loan and lease losses
41,885 100.00%
37,200 100.00% 23,071 100.00% 11,588 100.00% 9,016 100.00%
Reserve for unfunded lending commitments
(4)
1,188
1,487 421 518 397
Allowance for credit losses
(5)
$43,073
$38,687 $23,492 $12,106 $9,413
(1)
December 31, 2010 is presented in accordance with new consolidation guidance. Prior periods have not been restated.
(2)
Includes allowance for U.S. small business commercial loans of $1.5 billion, $2.4 billion, $2.4 billion, $1.4 billion and $578 million at December 31, 2010, 2009, 2008, 2007 and 2006, respectively.
(3)
Includes allowance for loan and lease losses for impaired commercial loans of $1.1 billion, $1.2 billion, $691 million, $123 million and $43 million at December 31, 2010, 2009, 2008, 2007 and 2006, respectively. Included in the
$1.1 billion at December 31, 2010 is $445 million related to U.S. small business commercial renegotiated TDR loans.
(4)
Amounts for 2010 and 2009 include the Merrill Lynch acquisition. The majority of the increase from December 31, 2008 relates to the fair value of the acquired Merrill Lynch unfunded lending commitments, excluding commitments
accounted for under the fair value option.
(5)
Includes $6.4 billion, $3.9 billion and $750 million related to PCI loans at December 31, 2010, 2009 and 2008, respectively.
n/a = not applicable
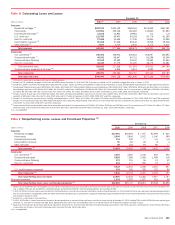
Table IX Selected Loan Maturity Data
(1, 2)
(Dollars in millions)
Due in One
Year or Less
Due After
One Year
Through
Five Years
Due After
Five Years Total
December 31, 2010
U.S. commercial $ 62,325 $ 84,412 $45,141
$191,878
U.S. commercial real estate 21,097 21,084 4,777
46,958
Non-U.S. and other
(3)
31,012 5,610 959
37,581
Total selected loans
$114,434 $111,106 $50,877
$276,417
Percent of total 41.4% 40.2% 18.4%
100%
Sensitivity of selected loans to changes in interest rates for loans due after one year:
Fixed interest rates $ 12,164 $25,619
Floating or adjustable interest rates 98,942 25,258
Total $111,106 $50,877
(1)
Loan maturities are based on the remaining maturities under contractual terms.
(2)
Includes loans accounted for under the fair value option.
(3)
Loan maturities include other consumer, commercial real estate and non-U.S. commercial loans.
Bank of America 2010 127