Bank of America 2010 Annual Report Download - page 179
Download and view the complete annual report
Please find page 179 of the 2010 Bank of America annual report below. You can navigate through the pages in the report by either clicking on the pages listed below, or by using the keyword search tool below to find specific information within the annual report.-
 1
1 -
2
-
3
-
4
-
5
-
6
-
7
-
8
-
9
-
10
-
11
-
12
-
13
-
14
-
15
-
16
-
17
-
18
-
19
-
20
-
21
-
22
-
23
-
24
-
25
-
26
-
27
-
28
-
29
-
30
-
31
-
32
-
33
-
34
-
35
-
36
-
37
-
38
-
39
-
40
-
41
-
42
-
43
-
44
-
45
-
46
-
47
-
48
-
49
-
50
-
51
-
52
-
53
-
54
-
55
-
56
-
57
-
58
-
59
-
60
-
61
-
62
-
63
-
64
-
65
-
66
-
67
-
68
-
69
-
70
-
71
-
72
-
73
-
74
-
75
-
76
-
77
-
78
-
79
-
80
-
81
-
82
-
83
-
84
-
85
-
86
-
87
-
88
-
89
-
90
-
91
-
92
-
93
-
94
-
95
-
96
-
97
-
98
-
99
-
100
-
101
-
102
-
103
-
104
-
105
-
106
-
107
-
108
-
109
-
110
-
111
-
112
-
113
-
114
-
115
-
116
-
117
-
118
-
119
-
120
-
121
-
122
-
123
-
124
-
125
-
126
-
127
-
128
-
129
-
130
-
131
-
132
-
133
-
134
-
135
-
136
-
137
-
138
-
139
-
140
-
141
-
142
-
143
-
144
-
145
-
146
-
147
-
148
-
149
-
150
-
151
-
152
-
153
-
154
-
155
-
156
-
157
-
158
-
159
-
160
-
161
-
162
-
163
-
164
-
165
-
166
-
167
-
168
-
 169
169 -
 170
170 -
 171
171 -
 172
172 -
 173
173 -
 174
174 -
 175
175 -
 176
176 -
 177
177 -
 178
178 -
 179
179 -
 180
180 -
 181
181 -
 182
182 -
 183
183 -
 184
184 -
 185
185 -
 186
186 -
 187
187 -
 188
188 -
 189
189 -
190
-
191
-
192
-
193
-
194
-
195
-
196
-
197
-
198
-
199
-
200
-
201
-
202
-
203
-
204
-
205
-
206
-
207
-
208
-
209
-
210
-
211
-
212
-
213
-
214
-
215
-
216
-
217
-
218
-
219
-
220
-
221
-
222
-
223
-
224
-
225
-
226
-
227
-
228
-
229
-
230
-
231
-
232
-
233
-
234
-
235
-
236
-
237
-
238
-
239
-
240
-
241
-
242
-
243
-
244
-
245
-
246
-
247
-
248
-
249
-
250
-
251
-
252
 |
 |

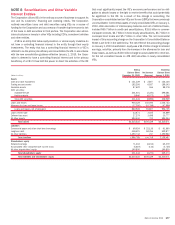
NOTE 8 Securitizations and Other Variable
Interest Entities
The Corporation utilizes VIEs in the ordinary course of business to support its
own and its customers’ financing and investing needs. The Corporation
routinely securitizes loans and debt securities using VIEs as a source of
funding for the Corporation and as a means of transferring the economic risk
of the loans or debt securities to third parties. The Corporation also admin-
isters structures or invests in other VIEs including CDOs, investment vehicles
and other entities.
A VIE is an entity that lacks equity investors or whose equity investors do
not have a controlling financial interest in the entity through their equity
investments. The entity that has a controlling financial interest in a VIE is
referred to as the primary beneficiary and consolidates the VIE. In accordance
with the new consolidation guidance effective January 1, 2010, the Corpo-
ration is deemed to have a controlling financial interest and is the primary
beneficiary of a VIE if it has both the power to direct the activities of the VIE
that most significantly impact the VIE’s economic performance and an obli-
gation to absorb losses or the right to receive benefits that could potentially
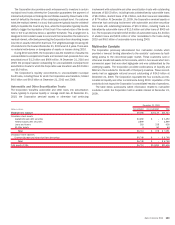
be significant to the VIE. As a result of this change in accounting, the
Corporation consolidated certain VIEs and former QSPEs that were previously
unconsolidated. Incremental assets of newly consolidated VIEs on January 1,
2010, after elimination of intercompany balances and net of deferred taxes,
included $69.7 billion in credit card securitizations, $15.6 billion in commer-
cial paper conduits, $4.7 billion in home equity securitizations, $4.7 billion in
municipal bond trusts and $5.7 billion in other VIEs. The net incremental
impact of this accounting change on the Corporation’s Consolidated Balance
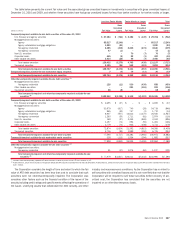
Sheet is set forth in the table below. The net effect of the accounting change
on January 1, 2010 shareholders’ equity was a $6.2 billion charge to retained
earnings, net-of-tax, primarily from the increase in the allowance for loan and
lease losses, as well as a $116 million charge to accumulated OCI, net-of-tax,
for the net unrealized losses on AFS debt securities in newly consolidated
VIEs.
(Dollars in millions)
Ending
Balance Sheet
December 31, 2009
Net Increase
(Decrease)
Beginning
Balance Sheet
January 1, 2010
Assets
Cash and cash equivalents $ 121,339 $ 2,807 $ 124,146
Trading account assets 182,206 6,937 189,143
Derivative assets 87,622 556 88,178
Debt securities:
Available-for-sale 301,601 (2,320) 299,281
Held-to-maturity 9,840 (6,572) 3,268
Total debt securities 311,441 (8,892) 302,549
Loans and leases 900,128 102,595 1,002,723
Allowance for loan and lease losses (37,200) (10,788) (47,988)
Loans and leases, net of allowance 862,928 91,807 954,735
Loans held-for-sale 43,874 3,025 46,899
Deferred tax asset 27,279 3,498 30,777
All other assets 593,543 701 594,244
Total assets
$2,230,232 $100,439 $2,330,671
Liabilities
Commercial paper and other short-term borrowings $ 69,524 $ 22,136 $ 91,660
Long-term debt 438,521 84,356 522,877
All other liabilities 1,490,743 217 1,490,960
Total liabilities
1,998,788 106,709 2,105,497
Shareholders’ equity
Retained earnings 71,233 (6,154) 65,079
Accumulated other comprehensive income (loss) (5,619) (116) (5,735)
All other shareholders’ equity 165,830 – 165,830
Total shareholders’ equity
231,444 (6,270) 225,174
Total liabilities and shareholders’ equity
$2,230,232 $100,439 $2,330,671
Bank of America 2010 177