Bank of America 2010 Annual Report Download - page 53
Download and view the complete annual report
Please find page 53 of the 2010 Bank of America annual report below. You can navigate through the pages in the report by either clicking on the pages listed below, or by using the keyword search tool below to find specific information within the annual report.-
 1
1 -
2
-
3
-
4
-
5
-
6
-
7
-
8
-
9
-
10
-
11
-
12
-
13
-
14
-
15
-
16
-
17
-
18
-
19
-
20
-
21
-
22
-
23
-
24
-
25
-
26
-
27
-
28
-
29
-
30
-
31
-
32
-
33
-
34
-
35
-
36
-
37
-
38
-
39
-
40
-
41
-
42
-
 43
43 -
 44
44 -
 45
45 -
 46
46 -
 47
47 -
 48
48 -
 49
49 -
 50
50 -
 51
51 -
 52
52 -
 53
53 -
 54
54 -
 55
55 -
 56
56 -
 57
57 -
 58
58 -
 59
59 -
 60
60 -
 61
61 -
 62
62 -
 63
63 -
64
-
65
-
66
-
67
-
68
-
69
-
70
-
71
-
72
-
73
-
74
-
75
-
76
-
77
-
78
-
79
-
80
-
81
-
82
-
83
-
84
-
85
-
86
-
87
-
88
-
89
-
90
-
91
-
92
-
93
-
94
-
95
-
96
-
97
-
98
-
99
-
100
-
101
-
102
-
103
-
104
-
105
-
106
-
107
-
108
-
109
-
110
-
111
-
112
-
113
-
114
-
115
-
116
-
117
-
118
-
119
-
120
-
121
-
122
-
123
-
124
-
125
-
126
-
127
-
128
-
129
-
130
-
131
-
132
-
133
-
134
-
135
-
136
-
137
-
138
-
139
-
140
-
141
-
142
-
143
-
144
-
145
-
146
-
147
-
148
-
149
-
150
-
151
-
152
-
153
-
154
-
155
-
156
-
157
-
158
-
159
-
160
-
161
-
162
-
163
-
164
-
165
-
166
-
167
-
168
-
169
-
170
-
171
-
172
-
173
-
174
-
175
-
176
-
177
-
178
-
179
-
180
-
181
-
182
-
183
-
184
-
185
-
186
-
187
-
188
-
189
-
190
-
191
-
192
-
193
-
194
-
195
-
196
-
197
-
198
-
199
-
200
-
201
-
202
-
203
-
204
-
205
-
206
-
207
-
208
-
209
-
210
-
211
-
212
-
213
-
214
-
215
-
216
-
217
-
218
-
219
-
220
-
221
-
222
-
223
-
224
-
225
-
226
-
227
-
228
-
229
-
230
-
231
-
232
-
233
-
234
-
235
-
236
-
237
-
238
-
239
-
240
-
241
-
242
-
243
-
244
-
245
-
246
-
247
-
248
-
249
-
250
-
251
-
252
 |
 |

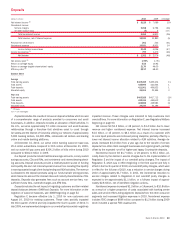
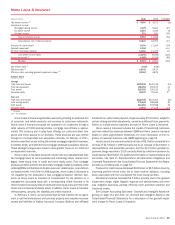
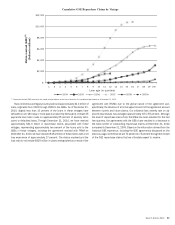
Collateralized Debt Obligation Exposure
CDO vehicles hold diversified pools of fixed-income securities and issue
multiple tranches of debt securities including commercial paper, mezzanine
and equity securities. Our CDO-related exposure can be divided into funded
and unfunded super senior liquidity commitment exposure, other super senior
exposure (i.e., cash positions and derivative contracts), warehouse, and sales
and trading positions. For more information on our CDO positions, see
Note 8 – Securitizations and Other Variable Interest Entities to the Consoli-
dated Financial Statements. Super senior exposure represents the most
senior class of commercial paper or notes that are issued by the CDO
vehicles. These financial instruments benefit from the subordination of all
other securities issued by the CDO vehicles.
In 2010, we incurred $573 million of losses resulting from our CDO-
related exposure compared to $2.2 billion in CDO-related losses in 2009. This
included $357 million in 2010 related to counterparty risk on our CDO-related
exposure compared to $910 million in 2009. Also included in these losses
were other-than-temporary impairment (OTTI) write-downs of $251 million in
2010 compared to losses of $1.2 billion in 2009 related to CDOs and
retained positions classified as AFS debt securities.
As presented in the table below, at December 31, 2010, our hedged and
unhedged super senior CDO exposure before consideration of insurance, net
of write-downs, was $2.0 billion compared to $3.6 billion at December 31,
2009.
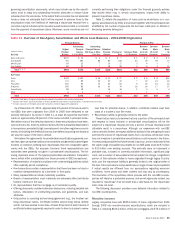
Super Senior Collateralized Debt Obligation Exposure
(Dollars in millions)
Subprime
(1)
Retained
Positions
Total
Subprime Non-Subprime
(2)
Total
December 31, 2010
Unhedged $ 721 $156 $ 877 $338
$1,215
Hedged
(3)
583 – 583 189
772
Total
$1,304 $156 $1,460 $527
$1,987
(1)
Classified as subprime when subprime consumer real estate loans make up at least 35 percent of the original net exposure value of the underlying collateral.
(2)
Includes highly-rated collateralized loan obligations and CMBS super senior exposure.
(3)
Hedged amounts are presented at carrying value before consideration of the insurance.
We value our CDO structures using market-standard models to model the
specific collateral composition and cash flow structure of each deal. Key
inputs to the models are prepayment rates, default rates and severities for
each collateral type, and other relevant contractual features. Unrealized
losses recorded in accumulated OCI on super senior cash positions and
retained positions from liquidated CDOs in aggregate decreased $382 million
during 2010 to $466 million at December 31, 2010.
At December 31, 2010, total super senior exposure of $2.0 billion was
marked at 18 percent, including $156 million of retained positions from
liquidated CDOs marked at 42 percent, $527 million of non-subprime expo-
sure marked at 39 percent and the remaining $1.3 billion of subprime
exposure marked at 14 percent of the original exposure amounts.
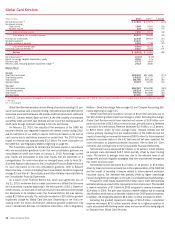
The table below presents our original total notional, mark-to-market re-
ceivable and credit valuation adjustment for credit default swaps and other
positions with monolines. The receivable for super senior CDOs reflects hedge
gains recorded from inception of the contracts in connection with write-downs
on the super senior CDOs in the table above.
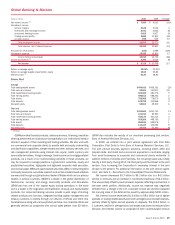
Credit Default Swaps with Monoline Financial Guarantors
(Dollars in millions)
Super Senior
CDOs
Other
Guaranteed
Positions Total
Super Senior
CDOs
Other
Guaranteed
Positions Total
December 31, 2010 December 31, 2009
Notional $ 3,241 $35,183
$38,424
$ 3,757 $38,834 $42,591
Mark-to-market or guarantor receivable $ 2,834 $ 6,367
$9,201
$ 2,833 $ 8,256 $11,089
Credit valuation adjustment (2,168) (3,107)
(5,275)
(1,873) (4,132) (6,005)
Total
$ 666 $ 3,260
$3,926
$ 960 $ 4,124 $ 5,084
Credit valuation adjustment % 77% 49%
57%
66% 50% 54%
(Write-downs) gains $ (386) $ 362
$(24)
$ (961) $ 98 $ (863)
Total monoline exposure, net of credit valuation adjustments, decreased
$1.2 billion during 2010. This decrease was driven by positive valuation
adjustments on legacy assets and terminated monoline contracts.
Other CDO Exposure
With the Merrill Lynch acquisition, we acquired a loan with a carrying value of
$4.2 billion as of December 31, 2010 that is collateralized by U.S. super
senior ABS CDOs. Merrill Lynch originally provided financing to the borrower
for an amount equal to approximately 75 percent of the fair value of the
collateral. The loan, which is recorded in All Other, has full recourse to the
borrower and all scheduled payments on the loan have been received. Events
of default under the loan are customary events of default, including failure to
pay interest when due and failure to pay principal at maturity. Collateral for the
loan is excluded from our CDO exposure discussions and the applicable
tables.
Bank of America 2010 51