Bank of America 2010 Annual Report Download - page 83
Download and view the complete annual report
Please find page 83 of the 2010 Bank of America annual report below. You can navigate through the pages in the report by either clicking on the pages listed below, or by using the keyword search tool below to find specific information within the annual report.-
 1
1 -
2
-
3
-
4
-
5
-
6
-
7
-
8
-
9
-
10
-
11
-
12
-
13
-
14
-
15
-
16
-
17
-
18
-
19
-
20
-
21
-
22
-
23
-
24
-
25
-
26
-
27
-
28
-
29
-
30
-
31
-
32
-
33
-
34
-
35
-
36
-
37
-
38
-
39
-
40
-
41
-
42
-
43
-
44
-
45
-
46
-
47
-
48
-
49
-
50
-
51
-
52
-
53
-
54
-
55
-
56
-
57
-
58
-
59
-
60
-
61
-
62
-
63
-
64
-
65
-
66
-
67
-
68
-
69
-
70
-
71
-
72
-
 73
73 -
 74
74 -
 75
75 -
 76
76 -
 77
77 -
 78
78 -
 79
79 -
 80
80 -
 81
81 -
 82
82 -
 83
83 -
 84
84 -
 85
85 -
 86
86 -
 87
87 -
 88
88 -
 89
89 -
 90
90 -
 91
91 -
 92
92 -
 93
93 -
94
-
95
-
96
-
97
-
98
-
99
-
100
-
101
-
102
-
103
-
104
-
105
-
106
-
107
-
108
-
109
-
110
-
111
-
112
-
113
-
114
-
115
-
116
-
117
-
118
-
119
-
120
-
121
-
122
-
123
-
124
-
125
-
126
-
127
-
128
-
129
-
130
-
131
-
132
-
133
-
134
-
135
-
136
-
137
-
138
-
139
-
140
-
141
-
142
-
143
-
144
-
145
-
146
-
147
-
148
-
149
-
150
-
151
-
152
-
153
-
154
-
155
-
156
-
157
-
158
-
159
-
160
-
161
-
162
-
163
-
164
-
165
-
166
-
167
-
168
-
169
-
170
-
171
-
172
-
173
-
174
-
175
-
176
-
177
-
178
-
179
-
180
-
181
-
182
-
183
-
184
-
185
-
186
-
187
-
188
-
189
-
190
-
191
-
192
-
193
-
194
-
195
-
196
-
197
-
198
-
199
-
200
-
201
-
202
-
203
-
204
-
205
-
206
-
207
-
208
-
209
-
210
-
211
-
212
-
213
-
214
-
215
-
216
-
217
-
218
-
219
-
220
-
221
-
222
-
223
-
224
-
225
-
226
-
227
-
228
-
229
-
230
-
231
-
232
-
233
-
234
-
235
-
236
-
237
-
238
-
239
-
240
-
241
-
242
-
243
-
244
-
245
-
246
-
247
-
248
-
249
-
250
-
251
-
252
 |
 |

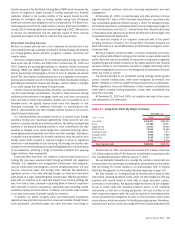
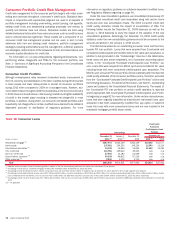
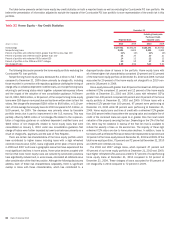
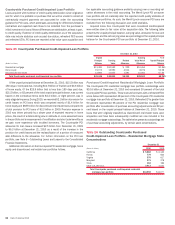
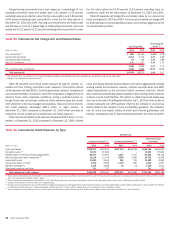
The table below presents outstandings, nonperforming loans and net
charge-offs by certain state concentrations for the home equity loan portfolio.
California and Florida combined represented 40 percent of the total home
equity portfolio and 44 percent of nonperforming home equity loans at
December 31, 2010. These states accounted for 55 percent of the home
equity net charge-offs for 2010 compared to 60 percent of the home equity
net charge-offs for 2009. In the New York area, the New York-Northern New
Jersey-Long Island MSA made up 11 percent of outstanding home equity loans
at both December 31, 2010 and 2009. This MSA comprised only six percent
of net charge-offs for both 2010 and 2009. The Los Angeles-Long Beach-
Santa Ana MSA within California made up 11 percent of outstanding home
equity loans at both December 31, 2010 and 2009 and comprised 11 percent
of net charge-offs for 2010 compared to 13 percent for 2009.
For information on representations and warranties related to our home
equity portfolio, see Representations and Warranties beginning on page 56
and Note 9 – Representations and Warranties Obligations and Corporate
Guarantees to the Consolidated Financial Statements.
Table 24 Home Equity State Concentrations
(Dollars in millions)
2010 2009 2010 2009 2010 2009
Outstandings Nonperforming Net Charge-offs
December 31
Year Ended
December 31
California
$35,426
$38,573
$708
$1,178
$2,341
$2,669
Florida
15,028
16,735
482
731
1,420
1,583
New Jersey
8,153
8,732
169
192
219
225
New York
8,061
8,752
246
274
273
262
Massachusetts
5,657
6,155
71
90
102
93
Other U.S./Non-U.S.
53,066
56,965
1,018
1,339
2,426
2,218
Total home equity loans
(1)
$125,391
$135,912
$2,694
$3,804
$6,781
$7,050
Total Countrywide purchased credit-impaired home
equity loan portfolio
12,590
13,214
Total home equity loan portfolio
$137,981
$149,126
(1)
Amount excludes the Countrywide PCI home equity loan portfolio.
Discontinued Real Estate
The discontinued real estate portfolio, totaling $13.1 billion at December 31,
2010, consisted of pay option and subprime loans acquired in the Country-
wide acquisition. Upon acquisition, the majority of the discontinued real
estate portfolio was considered credit-impaired and written down to fair value.
At December 31, 2010, the Countrywide PCI loan portfolio comprised
$11.7 billion, or 89 percent, of the total discontinued real estate portfolio.
This portfolio is included in All Other and is managed as part of our overall ALM
activities. See Countrywide Purchased Credit-impaired Loan Portfolio begin-
ning on page 82 for more information on the discontinued real estate
portfolio.
At December 31, 2010, the purchased discontinued real estate portfolio
that was not credit-impaired was $1.4 billion. Loans with greater than 90 per-
cent refreshed LTVs and CLTVs comprised 29 percent of the portfolio and
those with refreshed FICO scores below 620 represented 46 percent of the
portfolio. California represented 37 percent of the portfolio and 34 percent of
the nonperforming loans while Florida represented 10 percent of the portfolio
and 15 percent of the nonperforming loans at December 31, 2010. The Los
Angeles-Long Beach-Santa Ana MSA within California made up 16 percent of
outstanding discontinued real estate loans at December 31, 2010.
Pay option adjustable-rate mortgages (ARMs), which are included in the
discontinued real estate portfolio, have interest rates that adjust monthly and
minimum required payments that adjust annually, subject to resetting of the
loan if minimum payments are made and deferred interest limits are reached.
Annual payment adjustments are subject to a 7.5 percent maximum change.
To ensure that contractual loan payments are adequate to repay a loan, the
fully amortizing loan payment amount is re-established after the initial five or
10-year period and again every five years thereafter. These payment adjust-
ments are not subject to the 7.5 percent limit and may be substantial due to
changes in interest rates and the addition of unpaid interest to the loan
balance. Payment advantage ARMs have interest rates that are fixed for an
initial period of five years. Payments are subject to reset if the minimum
payments are made and deferred interest limits are reached. If interest
deferrals cause a loan’s principal balance to reach a certain level within
the first 10 years of the life of the loan, the payment is reset to the interest-
only payment; then at the 10-year point, the fully amortizing payment is
required.
The difference between the frequency of changes in the loans’ interest
rates and payments along with a limitation on changes in the minimum
monthly payments of 7.5 percent per year can result in payments that are
not sufficient to pay all of the monthly interest charges (i.e., negative amor-
tization). Unpaid interest charges are added to the loan balance until the loan
balance increases to a specified limit, which can be no more than 115 percent
of the original loan amount, at which time a new monthly payment amount
adequate to repay the loan over its remaining contractual life is established.
At December 31, 2010, the unpaid principal balance of pay option loans
was $14.6 billion, with a carrying amount of $11.8 billion, including $11.0 bil-
lion of loans that were credit-impaired upon acquisition. The total unpaid
principal balance of pay option loans with accumulated negative amortization
was $12.5 billion including $858 million of negative amortization. The per-
centage of borrowers electing to make only the minimum payment on option
ARMs was 69 percent at December 31, 2010. We continue to evaluate our
exposure to payment resets on the acquired negative-amortizing loans in-
cluding the Countrywide PCI pay option loan portfolio and have taken into
consideration several assumptions regarding this evaluation (e.g., prepay-
ment rates). Based on our expectations, 11 percent and three percent of the
pay option loan portfolio are expected to reset in 2011 and 2012. Approx-
imately four percent are expected to reset thereafter and approximately
82 percent are expected to default or repay prior to being reset.
Bank of America 2010 81