Bank of America 2010 Annual Report Download - page 168
Download and view the complete annual report
Please find page 168 of the 2010 Bank of America annual report below. You can navigate through the pages in the report by either clicking on the pages listed below, or by using the keyword search tool below to find specific information within the annual report.-
 1
1 -
2
-
3
-
4
-
5
-
6
-
7
-
8
-
9
-
10
-
11
-
12
-
13
-
14
-
15
-
16
-
17
-
18
-
19
-
20
-
21
-
22
-
23
-
24
-
25
-
26
-
27
-
28
-
29
-
30
-
31
-
32
-
33
-
34
-
35
-
36
-
37
-
38
-
39
-
40
-
41
-
42
-
43
-
44
-
45
-
46
-
47
-
48
-
49
-
50
-
51
-
52
-
53
-
54
-
55
-
56
-
57
-
58
-
59
-
60
-
61
-
62
-
63
-
64
-
65
-
66
-
67
-
68
-
69
-
70
-
71
-
72
-
73
-
74
-
75
-
76
-
77
-
78
-
79
-
80
-
81
-
82
-
83
-
84
-
85
-
86
-
87
-
88
-
89
-
90
-
91
-
92
-
93
-
94
-
95
-
96
-
97
-
98
-
99
-
100
-
101
-
102
-
103
-
104
-
105
-
106
-
107
-
108
-
109
-
110
-
111
-
112
-
113
-
114
-
115
-
116
-
117
-
118
-
119
-
120
-
121
-
122
-
123
-
124
-
125
-
126
-
127
-
128
-
129
-
130
-
131
-
132
-
133
-
134
-
135
-
136
-
137
-
138
-
139
-
140
-
141
-
142
-
143
-
144
-
145
-
146
-
147
-
148
-
149
-
150
-
151
-
152
-
153
-
154
-
155
-
156
-
157
-
 158
158 -
 159
159 -
 160
160 -
 161
161 -
 162
162 -
 163
163 -
 164
164 -
 165
165 -
 166
166 -
 167
167 -
 168
168 -
 169
169 -
 170
170 -
 171
171 -
 172
172 -
 173
173 -
 174
174 -
 175
175 -
 176
176 -
 177
177 -
 178
178 -
179
-
180
-
181
-
182
-
183
-
184
-
185
-
186
-
187
-
188
-
189
-
190
-
191
-
192
-
193
-
194
-
195
-
196
-
197
-
198
-
199
-
200
-
201
-
202
-
203
-
204
-
205
-
206
-
207
-
208
-
209
-
210
-
211
-
212
-
213
-
214
-
215
-
216
-
217
-
218
-
219
-
220
-
221
-
222
-
223
-
224
-
225
-
226
-
227
-
228
-
229
-
230
-
231
-
232
-
233
-
234
-
235
-
236
-
237
-
238
-
239
-
240
-
241
-
242
-
243
-
244
-
245
-
246
-
247
-
248
-
249
-
250
-
251
-
252
 |
 |

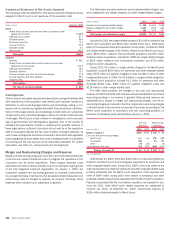
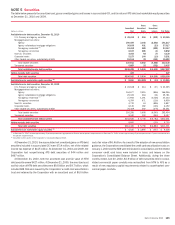
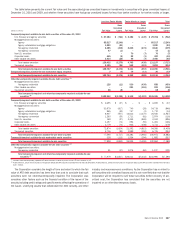
The Corporation recorded OTTI losses on AFS debt securities as presented
in the table below in 2010 and 2009. Upon initial impairment of a security,
total OTTI losses represent the excess of the amortized cost over the fair
value. For subsequent impairments of the same security, total OTTI losses
represent additional declines in fair value subsequent to the previously
recorded OTTI loss(es), if applicable. Unrealized OTTI losses recognized in
accumulated OCI represent the non-credit component of OTTI losses on AFS
debt securities. Net impairment losses recognized in earnings represent the
credit component of OTTI losses on AFS debt securities. In 2010, for certain
securities, the Corporation recognized credit losses in excess of unrealized
losses in accumulated OCI. In these instances, a portion of the credit losses
recognized in earnings has been offset by an unrealized gain. Balances in the
table exclude $51 million and $582 million of gross gains recorded in
accumulated OCI related to these securities for 2010 and 2009.
(Dollars in millions)
Non-agency
Residential
MBS
Non-agency
Commercial
MBS
Non-U.S.
Securities
Corporate
Bonds
Other
Taxable
Securities Total
2010
Total OTTI losses (unrealized and realized)
$(1,305) $(19) $(276) $ (6) $(568) $(2,174)
Unrealized OTTI losses recognized in accumulated OCI
817 15 16 2 357 1,207
Net impairment losses recognized in earnings $ (488) $ (4) $(260) $ (4) $(211) $ (967)
2009
Total OTTI losses (unrealized and realized) $(2,240) $ (6) $(360) $(87) $(815) $(3,508)
Unrealized OTTI losses recognized in accumulated OCI 672 – – – – 672
Net impairment losses recognized in earnings
$(1,568) $ (6) $(360) $(87) $(815) $(2,836)
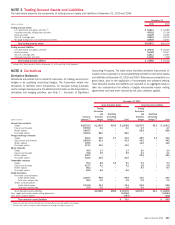
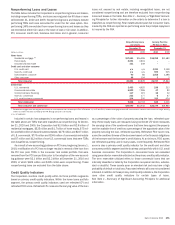
The table below presents activity for 2010 and 2009 related to the credit
component recognized in earnings on debt securities held by the Corporation
for which a portion of the OTTI loss remains in accumulated OCI. At Decem-
ber 31, 2010, those debt securities with OTTI for which a portion of the OTTI
loss remains in accumulated OCI primarily consisted of non-agency residential
mortgage-backed securities (RMBS) and CDOs.
(Dollars in millions)
2010 2009
Balance, January 1
$442
$–
Credit component of other-than-temporary impairment not
reclassified to accumulated OCI in connection with the cumulative
effect transition adjustment
(1)
–
22
Additions for the credit component on debt securities on which
other-than-temporary impairment losses were not previously
recognized
(2)
207
420
Additions for the credit component on debt securities on which
other-than-temporary impairment losses were previously
recognized
(2)
406
–
Balance, December 31
$1,055
$442
(1)
On January 1, 2009, the Corporation had securities with $134 million of OTTI previously recognized in earnings
of which $22 million represented the credit component and $112 million represented the non-credit component
which was reclassified to accumulated OCI through a cumulative effect transition adjustment.
(2)
In 2010 and 2009, the Corporation recognized $354 million and $2.4 billion of OTTI losses on debt securities
on which no portion of OTTI loss remained in accumulated OCI. OTTI losses related to these securities are
excluded from these amounts.
The Corporation estimates the portion of loss attributable to credit using a
discounted cash flow model and estimates the expected cash flows of the
underlying collateral using internal credit, interest rate and prepayment risk
models that incorporate management’s best estimate of current key assump-
tions such as default rates, loss severity and prepayment rates. Assumptions
used can vary widely from loan to loan and are influenced by such factors as
loan interest rate, geographical location of the borrower, borrower character-
istics and collateral type. The Corporation then uses a third-party vendor to
determine how the underlying collateral cash flows will be distributed to each
security issued from the structure. Expected principal and interest cash flows
on an impaired debt security are discounted using the book yield of each
individual impaired debt security.
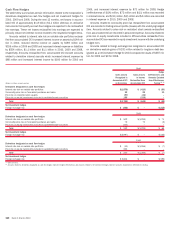
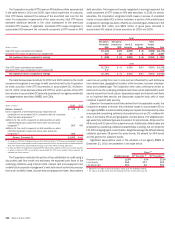
Based on the expected cash flows derived from the applicable model, the
Corporation expects to recover the unrealized losses in accumulated OCI on
non-agency RMBS. Annual constant prepayment speed and loss severity rates
are projected considering collateral characteristics such as LTV, creditworthi-
ness of borrowers (FICO) and geographic concentrations. The weighted-aver-
age severity by collateral type was 41 percent for prime bonds, 48 percent for
Alt-A bonds and 53 percent for subprime bonds. Additionally, default rates are
projected by considering collateral characteristics including, but not limited to
LTV, FICO and geographic concentration. Weighted-average life default rates by
collateral type were 38 percent for prime bonds, 58 percent for Alt-A bonds
and 62 percent for subprime bonds.
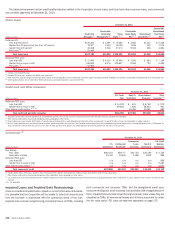
Significant assumptions used in the valuation of non-agency RMBS at
December 31, 2010 are presented in the table below.
Weighted-average 10
th
Percentile
(2)
90
th
Percentile
(2)
Range
(1)
Prepayment speed
12.6% 3.0% 27.1%
Loss severity
46.2 17.7 57.9
Life default rate
49.1 2.2 99.1
(1)
Represents the range of inputs/assumptions based upon the underlying collateral.
(2)
The value of a variable below which the indicated percentile of obser vations will fall.
166 Bank of America 2010