Bank of America 2010 Annual Report Download - page 95
Download and view the complete annual report
Please find page 95 of the 2010 Bank of America annual report below. You can navigate through the pages in the report by either clicking on the pages listed below, or by using the keyword search tool below to find specific information within the annual report.-
 1
1 -
2
-
3
-
4
-
5
-
6
-
7
-
8
-
9
-
10
-
11
-
12
-
13
-
14
-
15
-
16
-
17
-
18
-
19
-
20
-
21
-
22
-
23
-
24
-
25
-
26
-
27
-
28
-
29
-
30
-
31
-
32
-
33
-
34
-
35
-
36
-
37
-
38
-
39
-
40
-
41
-
42
-
43
-
44
-
45
-
46
-
47
-
48
-
49
-
50
-
51
-
52
-
53
-
54
-
55
-
56
-
57
-
58
-
59
-
60
-
61
-
62
-
63
-
64
-
65
-
66
-
67
-
68
-
69
-
70
-
71
-
72
-
73
-
74
-
75
-
76
-
77
-
78
-
79
-
80
-
81
-
82
-
83
-
84
-
 85
85 -
 86
86 -
 87
87 -
 88
88 -
 89
89 -
 90
90 -
 91
91 -
 92
92 -
 93
93 -
 94
94 -
 95
95 -
 96
96 -
 97
97 -
 98
98 -
 99
99 -
 100
100 -
 101
101 -
 102
102 -
 103
103 -
 104
104 -
 105
105 -
106
-
107
-
108
-
109
-
110
-
111
-
112
-
113
-
114
-
115
-
116
-
117
-
118
-
119
-
120
-
121
-
122
-
123
-
124
-
125
-
126
-
127
-
128
-
129
-
130
-
131
-
132
-
133
-
134
-
135
-
136
-
137
-
138
-
139
-
140
-
141
-
142
-
143
-
144
-
145
-
146
-
147
-
148
-
149
-
150
-
151
-
152
-
153
-
154
-
155
-
156
-
157
-
158
-
159
-
160
-
161
-
162
-
163
-
164
-
165
-
166
-
167
-
168
-
169
-
170
-
171
-
172
-
173
-
174
-
175
-
176
-
177
-
178
-
179
-
180
-
181
-
182
-
183
-
184
-
185
-
186
-
187
-
188
-
189
-
190
-
191
-
192
-
193
-
194
-
195
-
196
-
197
-
198
-
199
-
200
-
201
-
202
-
203
-
204
-
205
-
206
-
207
-
208
-
209
-
210
-
211
-
212
-
213
-
214
-
215
-
216
-
217
-
218
-
219
-
220
-
221
-
222
-
223
-
224
-
225
-
226
-
227
-
228
-
229
-
230
-
231
-
232
-
233
-
234
-
235
-
236
-
237
-
238
-
239
-
240
-
241
-
242
-
243
-
244
-
245
-
246
-
247
-
248
-
249
-
250
-
251
-
252
 |
 |

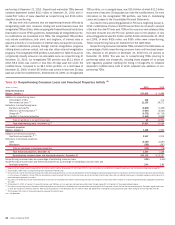
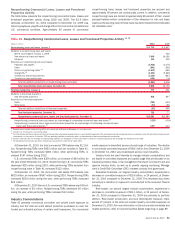
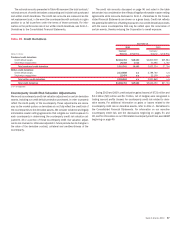
Nonperforming Commercial Loans, Leases and Foreclosed
Properties Activity
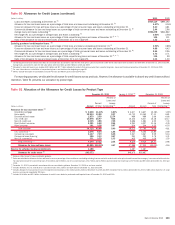
The table below presents the nonperforming commercial loans, leases and
foreclosed properties activity during 2010 and 2009. The $2.9 billion
decrease at December 31, 2010 compared to December 31, 2009 was
driven by paydowns, payoffs and charge-offs in the commercial real estate and
U.S. commercial portfolios. Approximately 95 percent of commercial
nonperforming loans, leases and foreclosed properties are secured and
approximately 40 percent are contractually current. In addition, commercial
nonperforming loans are carried at approximately 68 percent of their unpaid
principal balance before consideration of the allowance for loan and lease
losses as the carrying value of these loans has been reduced to the estimated
net realizable value.
Table 41 Nonperforming Commercial Loans, Leases and Foreclosed Properties Activity
(1, 2)
(Dollars in millions)
2010 2009
Nonperforming loans and leases, January 1
$12,703
$6,497
Additions to nonperforming loans and leases:
Merrill Lynch balance, January 1, 2009
–
402
New nonaccrual loans and leases
7,809
16,190
Advances
330
339
Reductions in nonperforming loans and leases:
Paydowns and payoffs
(3,938)
(3,075)
Sales
(841)
(630)
Returns to performing status
(3)
(1,607)
(461)
Charge-offs
(4)
(3,221)
(5,626)
Transfers to foreclosed properties
(1,045)
(857)
Transfers to loans held-for-sale
(354)
(76)
Total net additions (reductions) to nonperforming loans and leases
(2,867)
6,206
Total nonperforming loans and leases, December 31
9,836
12,703
Foreclosed properties, January 1
777
321
Additions to foreclosed properties:
New foreclosed properties
818
857
Reductions in foreclosed properties:
Sales
(780)
(310)
Write-downs
(90)
(91)
Total net additions (reductions) to foreclosed properties
(52)
456
Total foreclosed properties, December 31
725
777
Nonperforming commercial loans, leases and foreclosed properties, December 31
$10,561
$13,480
Nonperforming commercial loans and leases as a percentage of outstanding commercial loans and leases
(5)
3.35%
4.00%
Nonperforming commercial loans, leases and foreclosed properties as a percentage of outstanding commercial loans,
leases and foreclosed properties
(5)
3.59
4.23
(1)
Balances do not include nonperforming LHFS of $1.5 billion and $4.5 billion at December 31, 2010 and 2009.
(2)
Includes U.S. small business commercial activity.
(3)
Commercial loans and leases may be restored to performing status when all principal and interest is current and full repayment of the remaining contractual principal and interest is expected or when the loan otherwise becomes well-
secured and is in the process of collection. TDRs are generally classified as performing after a sustained period of demonstrated payment performance.
(4)
Business card loans are not classified as nonperforming; therefore, the charge-offs on these loans have no impact on nonperforming activity and accordingly are excluded from this table.
(5)
Outstanding commercial loans and leases exclude loans accounted for under the fair value option.
At December 31, 2010, the total commercial TDR balance was $1.2 bil-
lion. Nonperforming TDRs were $952 million and are included in Table 41.
Nonperforming TDRs increased $466 million while performing TDRs in-
creased $147 million during 2010.
U.S. commercial TDRs were $356 million, an increase of $60 million for
the year ended December 31, 2010. Nonperforming U.S. commercial TDRs
decreased $52 million during 2010, while performing TDRs excluded from
nonperforming loans in Table 41 increased $112 million.
At December 31, 2010, the commercial real estate TDR balance was
$815 million, an increase of $547 million during 2010. Nonperforming TDRs
increased $524 million during the year, while performing TDRs increased
$23 million.
At December 31, 2010 the non-U.S. commercial TDR balance was $19 mil-
lion, an increase of $6 million. Nonperforming TDRs decreased $6 million
during the year, while performing TDRs increased $12 million.
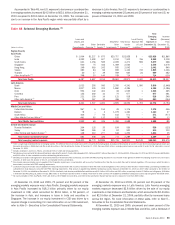
Industry Concentrations
Table 42 presents commercial committed and utilized credit exposure by
industry and the total net credit default protection purchased to cover the
funded and unfunded portions of certain credit exposures. Our commercial
credit exposure is diversified across a broad range of industries. The decline
in commercial committed exposure of $68.1 billion from December 31, 2009
to December 31, 2010 was broad-based across most industries.
Industry limits are used internally to manage industry concentrations and
are based on committed exposures and capital usage that are allocated on an
industry-by-industry basis. A risk management framework is in place to set and
approve industry limits, as well as to provide ongoing monitoring. Manage-
ment’s Credit Risk Committee (CRC) oversees industry limit governance.
Diversified financials, our largest industry concentration, experienced a
decrease in committed exposure of $25.8 billion, or 24 percent, at Decem-
ber 31, 2010 compared to December 31, 2009. This decrease was driven
primarily by a reduction in exposure to conduits tied to the consumer finance
industry.
Real estate, our second largest industry concentration, experienced a
decrease in committed exposure of $21.1 billion, or 23 percent, at Decem-
ber 31, 2010 compared to December 31, 2009 due primarily to portfolio
attrition. Real estate construction and land development exposure repre-
sented 27 percent of the total real estate industry committed exposure at
December 31, 2010. For more information on the commercial real estate and
related portfolios, refer to Commercial Real Estate beginning on page 89.
Bank of America 2010 93