Bank of America 2010 Annual Report Download - page 128
Download and view the complete annual report
Please find page 128 of the 2010 Bank of America annual report below. You can navigate through the pages in the report by either clicking on the pages listed below, or by using the keyword search tool below to find specific information within the annual report.-
 1
1 -
2
-
3
-
4
-
5
-
6
-
7
-
8
-
9
-
10
-
11
-
12
-
13
-
14
-
15
-
16
-
17
-
18
-
19
-
20
-
21
-
22
-
23
-
24
-
25
-
26
-
27
-
28
-
29
-
30
-
31
-
32
-
33
-
34
-
35
-
36
-
37
-
38
-
39
-
40
-
41
-
42
-
43
-
44
-
45
-
46
-
47
-
48
-
49
-
50
-
51
-
52
-
53
-
54
-
55
-
56
-
57
-
58
-
59
-
60
-
61
-
62
-
63
-
64
-
65
-
66
-
67
-
68
-
69
-
70
-
71
-
72
-
73
-
74
-
75
-
76
-
77
-
78
-
79
-
80
-
81
-
82
-
83
-
84
-
85
-
86
-
87
-
88
-
89
-
90
-
91
-
92
-
93
-
94
-
95
-
96
-
97
-
98
-
99
-
100
-
101
-
102
-
103
-
104
-
105
-
106
-
107
-
108
-
109
-
110
-
111
-
112
-
113
-
114
-
115
-
116
-
117
-
 118
118 -
 119
119 -
 120
120 -
 121
121 -
 122
122 -
 123
123 -
 124
124 -
 125
125 -
 126
126 -
 127
127 -
 128
128 -
 129
129 -
 130
130 -
 131
131 -
 132
132 -
 133
133 -
 134
134 -
 135
135 -
 136
136 -
 137
137 -
 138
138 -
139
-
140
-
141
-
142
-
143
-
144
-
145
-
146
-
147
-
148
-
149
-
150
-
151
-
152
-
153
-
154
-
155
-
156
-
157
-
158
-
159
-
160
-
161
-
162
-
163
-
164
-
165
-
166
-
167
-
168
-
169
-
170
-
171
-
172
-
173
-
174
-
175
-
176
-
177
-
178
-
179
-
180
-
181
-
182
-
183
-
184
-
185
-
186
-
187
-
188
-
189
-
190
-
191
-
192
-
193
-
194
-
195
-
196
-
197
-
198
-
199
-
200
-
201
-
202
-
203
-
204
-
205
-
206
-
207
-
208
-
209
-
210
-
211
-
212
-
213
-
214
-
215
-
216
-
217
-
218
-
219
-
220
-
221
-
222
-
223
-
224
-
225
-
226
-
227
-
228
-
229
-
230
-
231
-
232
-
233
-
234
-
235
-
236
-
237
-
238
-
239
-
240
-
241
-
242
-
243
-
244
-
245
-
246
-
247
-
248
-
249
-
250
-
251
-
252
 |
 |

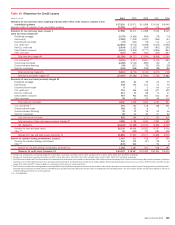
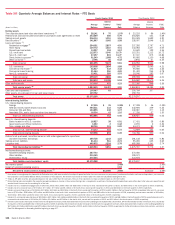
(Dollars in millions)
2010 2009 2008 2007 2006
Loans and leases outstanding at December 31
(5)
$937,119
$895,192 $926,033 $871,754 $706,490
Allowance for loan and lease losses as a percentage of total loans and leases
outstanding at December 31
(5)
4.47%
4.16% 2.49% 1.33% 1.28%
Consumer allowance for loan and lease losses as a percentage of total consumer loans and leases
outstanding at December 31
5.40
4.81 2.83 1.23 1.19
Commercial allowance for loan and lease losses as a percentage of total
commercial loans and leases outstanding at December 31
(5)
2.44
2.96 1.90 1.51 1.44
Average loans and leases outstanding
(5)
$954,278
$941,862 $905,944 $773,142 $652,417
Net charge-offs as a percentage of average loans and leases outstanding
(5)
3.60%
3.58% 1.79% 0.84% 0.70%
Allowance for loan and lease losses as a percentage of total nonperforming loans and leases
at December 31
(5, 6, 7)
136
111 141 207 505
Ratio of the allowance for loan and lease losses at December 31 to net charge-offs
1.22
1.10 1.42 1.79 1.99
Excluding purchased credit-impaired loans:
(8)
Allowance for loan and lease losses as a percentage of total loans and leases outstanding at December 31
(5)
3.94%
3.88% 2.53% n/a n/a
Consumer allowance for loan and lease losses as a percentage of total consumer loans and leases
outstanding at December 31
4.66
4.43 2.91 n/a n/a
Commercial allowance for loan and lease losses as a percentage of total commercial loans and leases
outstanding at December 31
(5)
2.44
2.96 1.90 n/a n/a
Net charge-offs as a percentage of average loans and leases outstanding
(5)
3.73
3.71 1.83 n/a n/a
Allowance for loan and lease losses as a percentage of total nonperforming loans and leases
at December 31
(5, 6, 7)
116
99 136 n/a n/a
Ratio of the allowance for loan and lease losses at December 31 to net charge-offs
1.04
1.00 1.38 n/a n/a
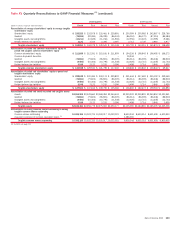
(5)
Outstanding loan and lease balances and ratios do not include loans accounted for under the fair value option. Loans accounted for under the fair value option were $3.3 billion, $4.9 billion, $5.4 billion and $4.6 billion at
December 31, 2010, 2009, 2008 and 2007, respectively. Average loans accounted for under the fair value option were $4.1 billion, $6.9 billion, $4.9 billion and $3.0 billion for 2010, 2009, 2008 and 2007, respectively.
(6)
Allowance for loan and lease losses includes $22.9 billion, $17.7 billion, $11.7 billion, $6.5 billion and $5.4 billion allocated to products that were excluded from nonperforming loans, leases and foreclosed properties at
December 31, 2010, 2009, 2008, 2007 and 2006, respectively.
(7)
For more information on our definition of nonperforming loans, see the discussion beginning on page 85.
(8)
Metrics exclude the impact of Countrywide consumer PCI loans and Merrill Lynch commercial PCI loans.
n/a = not applicable
126 Bank of America 2010
Table VII Allowance for Credit Losses (continued)